Atlas Known Issues
The KPMP Atlas software team acknowledges that the tools may not always work ideally or the same from browser to browser. We want to acknowledge these issues for users and, if possible, provide potential workarounds until these issues can be resolved.
Have you run into an issue not reported here? Please report issues through our Give us your feedback link (above).
The Atlas Explorer
The Atlas Explorer incorporates an easy-to-use search engine which allows users to search for markers or cell types of interest and view summary data visualizations across the following data types:
- Single-nucleus RNA-seq
- Single-cell RNA-seq
- Regional transcriptomics
Summary of participants by data type
A summary of the data available in the Atlas Explorer is available on the Kidney Tissue Atlas homepage.
The single-nucleus and single-cell datasets are described in detail in this preprint (Note: the v1.0 Atlas Explorer includes only a subset of the samples described); the manuscript also details the approach to assigning cell types to the clustered data.
The cell types noted in the application were established as a joint effort with the HuBMAP Consortium. The HuBMAP ASCT+B Reporter tool can be used to visualize the anatomical structures, cell types, and biomarkers (ASCT+B) authored by the domain experts. The cell types and anatomical structures are also being represented in the Cell Ontology and Uberon, respectively.
Search by gene
Searching for a gene presents the user with various visualizations and data tables displaying how the gene is expressed in the selected data type.
Choosing the single-nucleus or single-cell RNA-seq data types yields a visualization page with a "reference UMAP" showing how the full dataset was clustered as well as the inferred cell type/state of each cluster (see this preprint for more details on the clustering and cell attribution methods); a feature plot showing the expression of the selected gene, and a table detailing the expression of the selected gene in each cluster (compared to all other clusters) (Figure 1). Users can also filter the dataset down to only include AKI, CKD, or healthy reference samples - this updates the gene feature plot and the table (but not the reference UMAP image).
.png)
Searching for a gene and choosing the regional transcriptomics data type yields a visualization page with a "bubble plot" showing the expression of the selected gene across all tissue types (AKI, CKD, and healthy reference tissue) and microdissected regions, and a table detailing the expression of the selected gene in each region compared to all other regions (Figure 2). Users can also filter the dataset down to only include AKI, CKD, or healthy reference samples.
Search by cell type
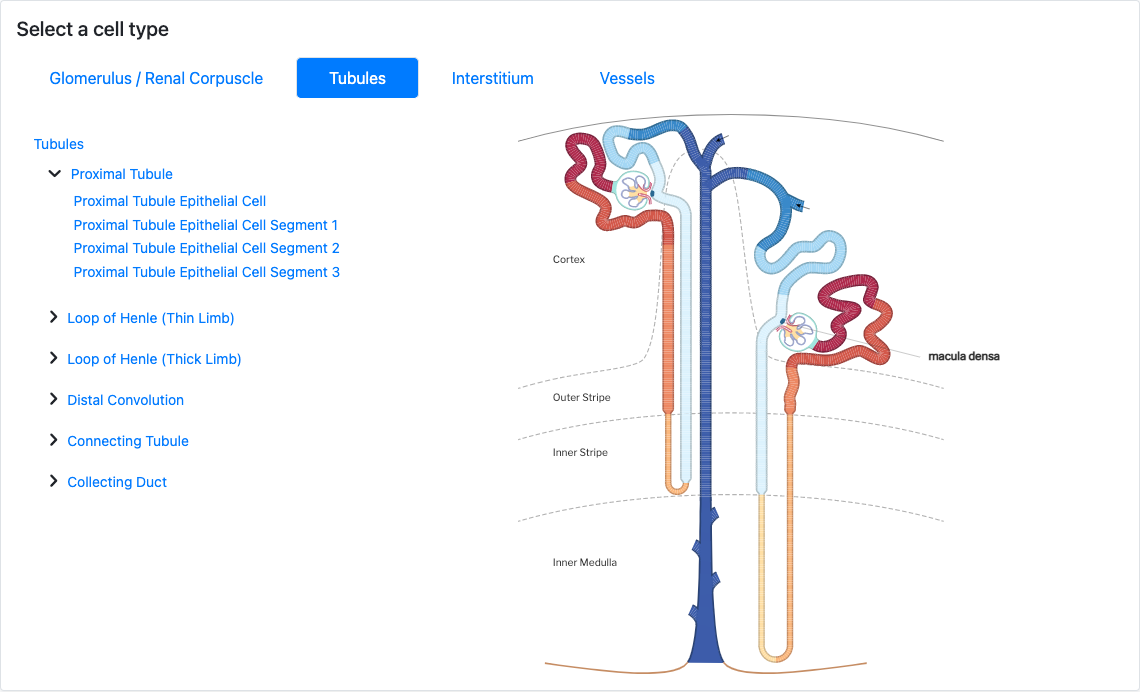
Users can also begin their search with a cell type instead of a gene. After searching for a cell type or selecting one from the renal corpuscle or nephron schemata (Figure 3), a user can see all of the data currently mapped to that cell type. As of Atlas Explorer v1.0, the available data will be single-nucleus and single-cell clusters or microdissected regions. After choosing one of the clusters/regions, users are presented with a table showing which genes are most differentially expressed in the selected cluster/region.
The Atlas Repository
The Atlas Repository provides access to the dataset files being generated by KPMP. The datasets available in the repository are a combination of raw and processed data from KPMP participant biopsies and reference tissue samples. Datasets are routinely added as they are generated and have completed a quality control process. Some data files shown in the repository are "controlled access", meaning they can only be retrieved after a data use agreement is in place between KPMP and your organization. A summary of the data available in the repository is available on the Kidney Tissue Atlas homepage.
FILTERING
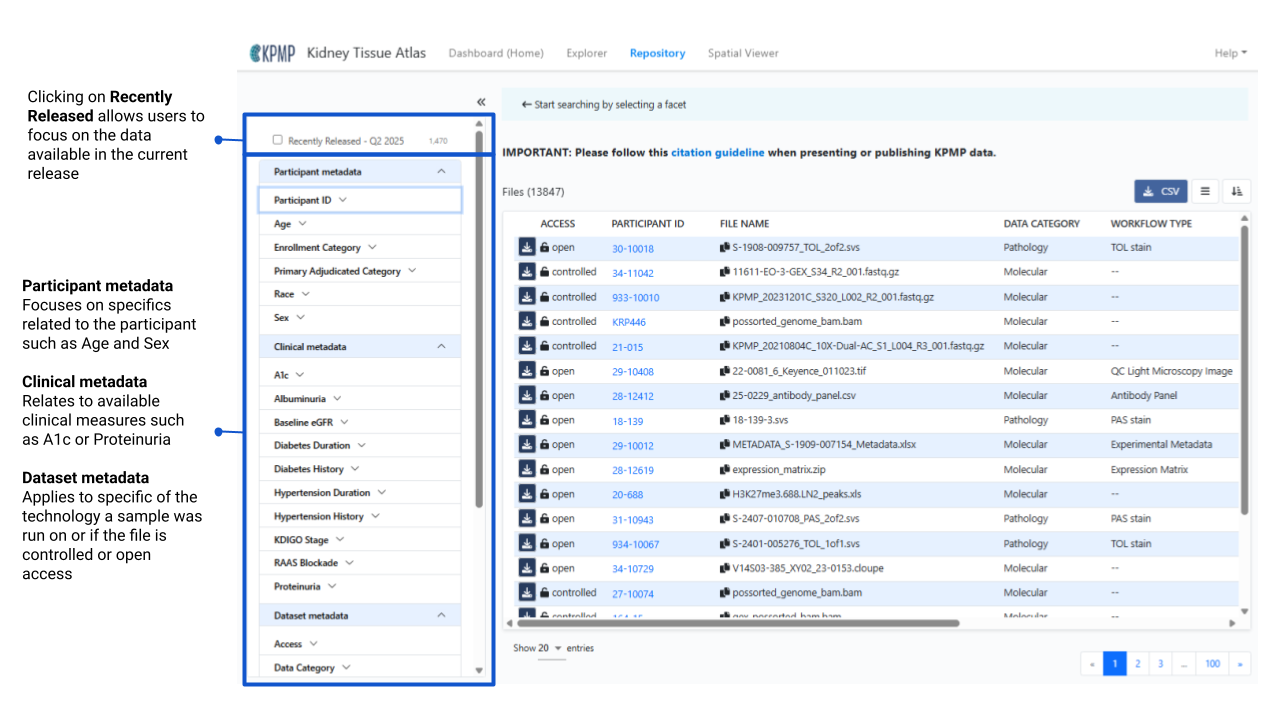
Users may immediately filter to the most recently released data packages by clicking the Recently Released - QX Year option at the top of the filtering panel. Additional filtering options are organized into three main sections:
- Participant metadata
- Clinical metadata
- Data set metadata
Within each section the options are organized alphabetically for ease of navigation.
Filtering Instructional Video (1:55)
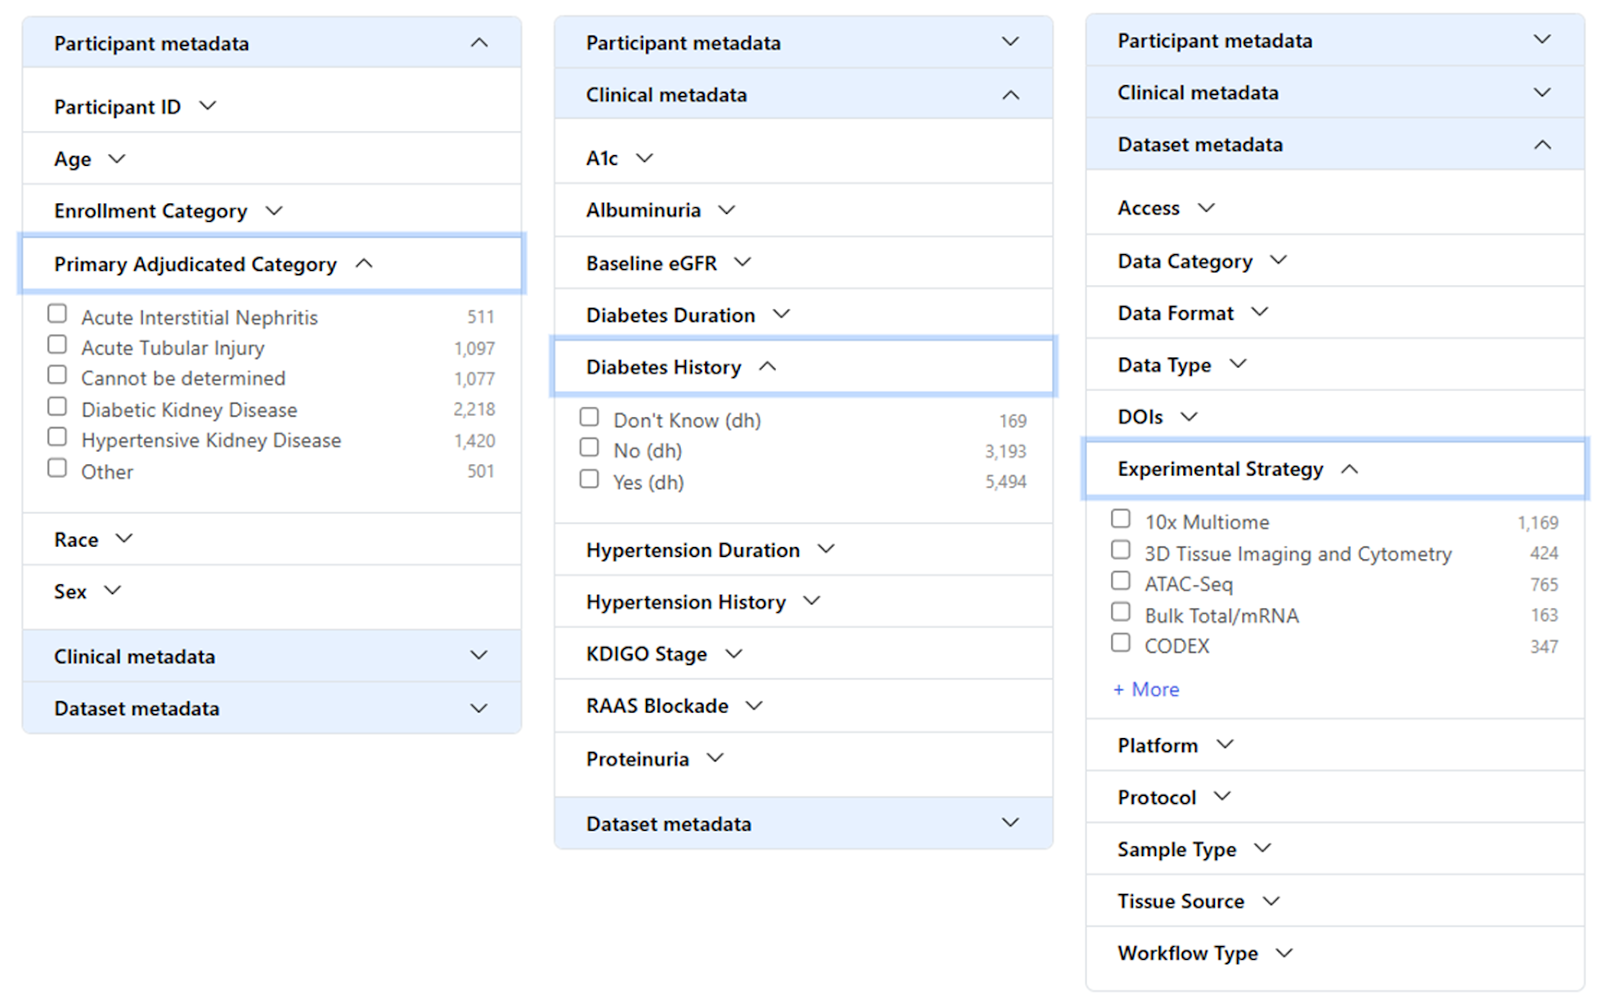
PARTICIPANT METADATA
- Age: age is a binned value in the publicly available data
- Enrollment Category: The disease or reference study in which participants were enrolled into KPMP (AKI, CKD, DM-R, Healthy Reference). Other miscellaneous categories are based on non-KPMP sample disease categories.
- Primary Adjudication Category: The disease designation based on KPMP internal adjudication efforts
- Race: self-reported from KPMP participants
- Sex: sex at birth
CLINICAL METADATA
- A1c: reported as binned categories of percent
- Albuminuria: reported as binned categories in units of mg/g
- Baseline eGFR: reported as binned categories in ml/min/1.73m2. Baseline eGFR for AKI calculated with the race-free CKD-EPI equation using: 1) median of the last 1-3 outpatient serum creatinine measurements from day 7 to 365 prior to enrollment, or 2) imputed serum creatinine when there are no serum creatinine values available for 7 to 365 days prior to enrollment
- Diabetes Duration: Reported as binned categories in Years
- Diabetes History: Has your doctor or health care provider told you that you have diabetes? Responses: Yes, No, or Don’t know.
- Hypertension Duration: Reported as binned categories in Years
- Hypertension History: Has a doctor or other health care provider ever told you that you have high blood pressure or hypertension? Responses: Yes, No, or Don’t know.
- KDIGO Stage: Only for AKI participants. Maximum KDIGO stage by serum creatinine.
- RAAS Blockade: Yes or No on a RAAS Blockade. RAAS blockade is defined by the third level of ATC code from RxCUI: ace inhibitors, angiotensin ii receptor blockers, or aldosterone antagonists excluding Amlodipine, hydrochlorothiazide, chlorthalidone/triamterene, and Hydrochlorothiazide/Triamterene
- Proteinuria: reported as binned categories in units of mg
DATASET METADATA
- Access: Controlled or Open access. Controlled access requires a Data Use Agreement be put into place for KPMP to share this type of data. Please complete the Controlled Access Request for any controlled access data needs.
- Data Category: Biomarker, Clinical, Molecular, Pathology
- Data Format: KPMP data comes in various file formats, all available formats are listed here.
- Data Type:
- Biomarker data types: Biomarker Data, Metabolomics, Proteomics, Transcriptomics
- Clinical: Clinical Study Data
- Molecular: Epigenetics, Imaging, Proteomics, Transcriptomics
- Pathology: Imaging, Pathology Study Data
- DOIs: Any files currently associated with a DOI for a KPMP publication will be assigned to all associated DOIs
- Experimental Strategy: This is a list of all the available technologies KPMP samples have been run on to date.
- Platform: Technology platform name
- Protocol: Indicates which study protocol a sample was enrolled under: HRT Living Donor Protocol, HRT Percutaneous Nephrolithotomy Protocol, KPMP Main Protocol, KPMP Pilot 1 Protocol, KPMP Pilot1v2 Protocol, Other (non-KPMP) Protocol
- Sample Type: Not all samples come from the KPMP Main Protocol following our participant biopsy protocol. When initially establishing KPMP alternate sample types were included: Transplant Pre-perfusion Biopsy, Intra-operative Biopsy, Percutaneous Needle Biopsy, Intra-operative Needle Biopsy, Tumor Nephrectomy, Deceased Donor Nephrectomy, Partial Tumor Nephrectomy, Total Tumor Nephrectomy, Transplant Surveillance Biopsy, Biopsy
- Tissue Source: identifies, at a high level, the place a specific tissue was supplied. The KPMP main study samples are sourced from KPMP recruitment sites or KPMP Healthy Reference Sites. Additional tissue has been supplied by DiaComp (Diabetic Complications Consortium), KPMP Tissue Interrogation Sites, or KPMP pilot tissue supplied by KPMP nephrectomy tissue from the University of Michigan.
- Workflow Type: additional detailed information coming from the Experimental Strategy. For example, Light Microscopic Whole Slide Images as an Experimental Strategy is made up of multiple stain types: Frozen H&E stain, H&E stain, PAS stain, SIL stain, TOL stain, TRI stain, and Other stain types.
Multi-select options from any of these sections will help users narrow down to a specific cohort of participants and only focus on the data types of interest.
USING THE DATA TABLE
The data table shows the list of data available in the Atlas Repository based on the selected filtering options.

DATA TABLE COLUMN HEADERS
- *Access: indicates if files are open or controlled access. Open access files may be downloaded directly from the Atlas Repository. Controlled access files require a Data Use Agreement to be in place with the user’s institution and KPMP.
- *Participant ID: KPMP identification used to align data on the participant level.
- File UUID: a Universally Unique Identifier (UUID) randomly generated to keep all files unique.
- *File Name: name of the file or package generally created at the data generation site.
- *Data Category: there are currently 4 distinct types of data categories: Biomarker, Clinical, Molecular, Pathology
- *Data Format: File format of the data or the files within a data package, some examples include: fastq, bam, xlsx docx pdf
- Data Type: File format of the data or the files within a data package, some examples include: fastq, bam, xlsx docx pdf
- Data Type: a subset of the Data Categories: Biomarker Data, Clinical Study Data, Epigenetics, Imaging, Metabolomics, Pathology Study Data, Proteomics, Transcriptomics
- *DOIs: Specific sets of data found in our DOI Collection.
- Experimental Strategy: available technologies or analysis from KPMP data generators such as Single-cell RNA-Seq, Pathology Descriptor Scoring, Spatial Transcriptomics.
- *Platform: platform a given technology was run on
- Protocol: protocols participants were enrolled under to be part of the KPMP Atlas
- Workflow: more granular details or specific sets of data or analysis for each technology.
- *Size: the actual size of the data file.
*Column headers that are the default in the Atlas
DOWNLOAD CSV
Once a discrete list of files has been created based on a user’s specific filtering criteria, a csv format list can be downloaded and used for informing data requests, internal tracking, etc.
The Atlas Spatial Viewer
The following data types have been incorporated into the Atlas Spatial Viewer:
- Light Microscopic Whole Slide Images
- 3D Tissue Imaging and Cytometry
- Spatial Transcriptomics
- CODEX
- Spatial Metabolomics
For more details on these spatial technologies, refer to the Technologies help documentation under Imaging and Metabolomics.
The data available in the Spatial Viewer are routinely added as they are generated and quality checked. A summary of the data available in the Spatial Viewer can be found on the Kidney Tissue Atlas homepage.
The spatial images presented in the application have been pre-processed in order to convert them to OME (Open Microscopy Environment) TIFF (tagged image file format) using Bio-Formats bftools version 5.8.
Each dataset is identified by a sample ID, which is derived from a segment of a participant's biopsy tissue. Every sample ID may be traced back to a single participant ID.
NAVIGATION
The Atlas Spatial Viewer allows you to search the available KPMP spatial datasets by data-level and participant-level attributes and visualize the associated datasets.

DATASET LIST
Filter panel
Narrowing your search to a focused selection of datasets is accomplished using the filter panel on the left-hand side of the screen. The filter panel is divided in two tabs, DATASET and PARTICIPANT, with each tab containing attributes by which to filter the dataset list to the right of the filter panel.
Participant-level filters allow searching for datasets that contain particular participant-level attributes such as age range, tissue type, etc. Dataset-level filters allow a user to search for different types of datasets (Light Microscopy vs 3D Cytometry).
To open a dataset in the viewer, click on the link in the SAMPLE ID column.
Sorting and resizing columns
Click on a column heading to sort the data in the column ascending order. Click on the column header a second time to sort in descending order.
When hovering over the column heading you will see a blue line that appears at the right hand side of the column. Click and drag the blue line to increase or decrease the column width.
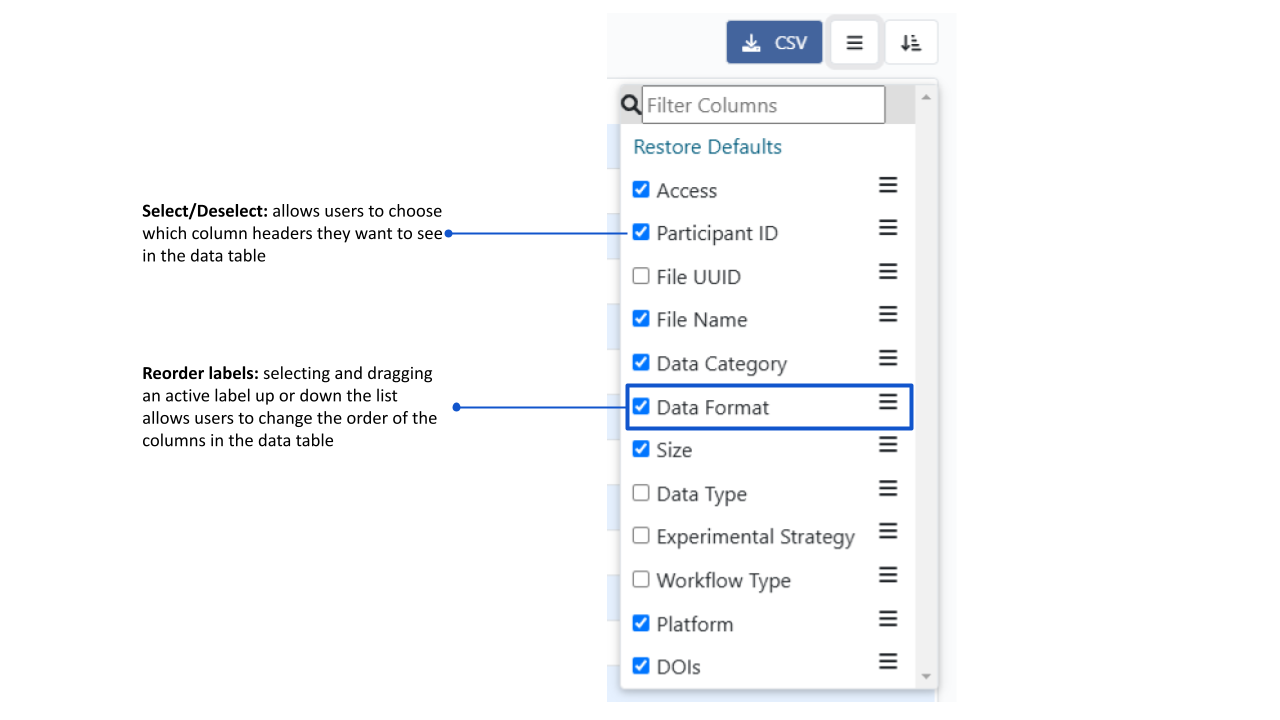
Showing/hiding columns
By default the dataset list displays the SAMPLE ID, DATA TYPE, and IMAGE TYPE columns. Click the left button at the top of the dataset list and a field chooser will appear which allows you show additional columns or hide the active columns. NOTE:e SAMPLE ID column cannot be hidden.
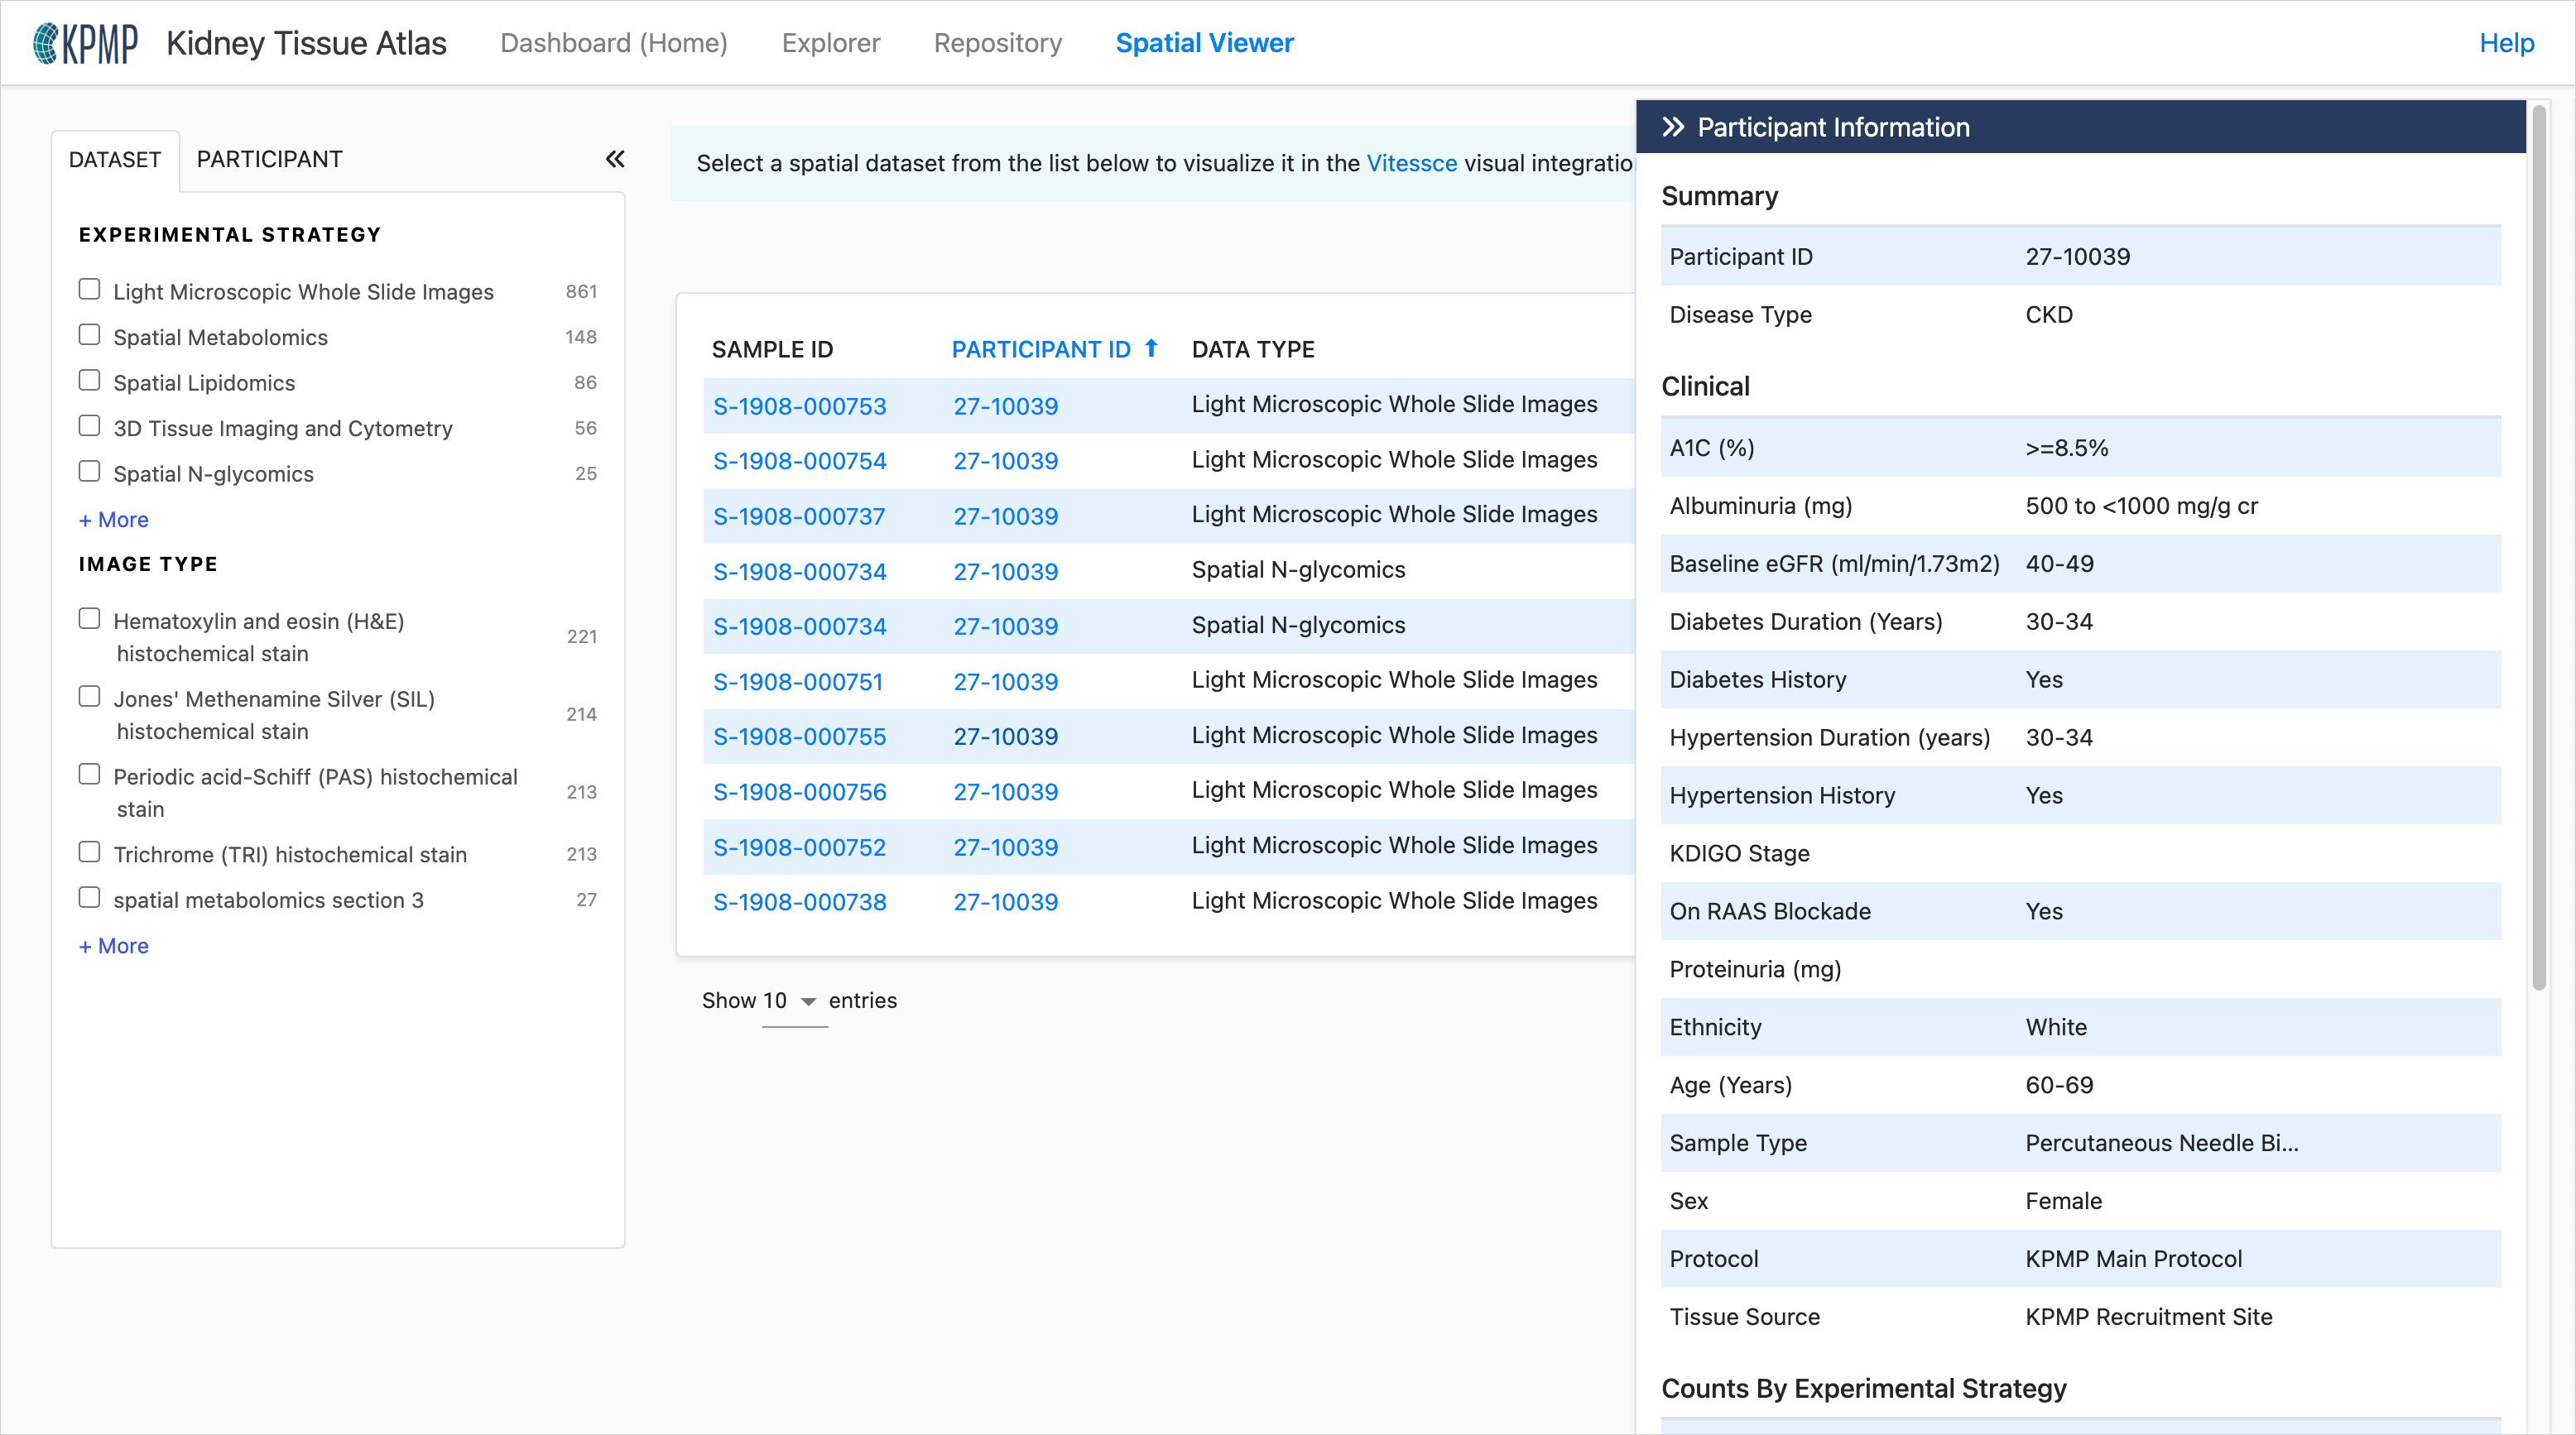
Participant information panel
Click on the Participant ID in the dataset list or when viewing an image to view the Participant Information panel. This panel contains clinical information (e.g. disease, age, eGFR) and data available within the Atlas for the selected participant.
VISUALIZATIONS
The Spatial Viewer uses the Vitessce visualization platform as its visualization engine. The layout and features/functionality of the visualization page will be specific to the data type selected.
Light Microscopic Whole Slide Images
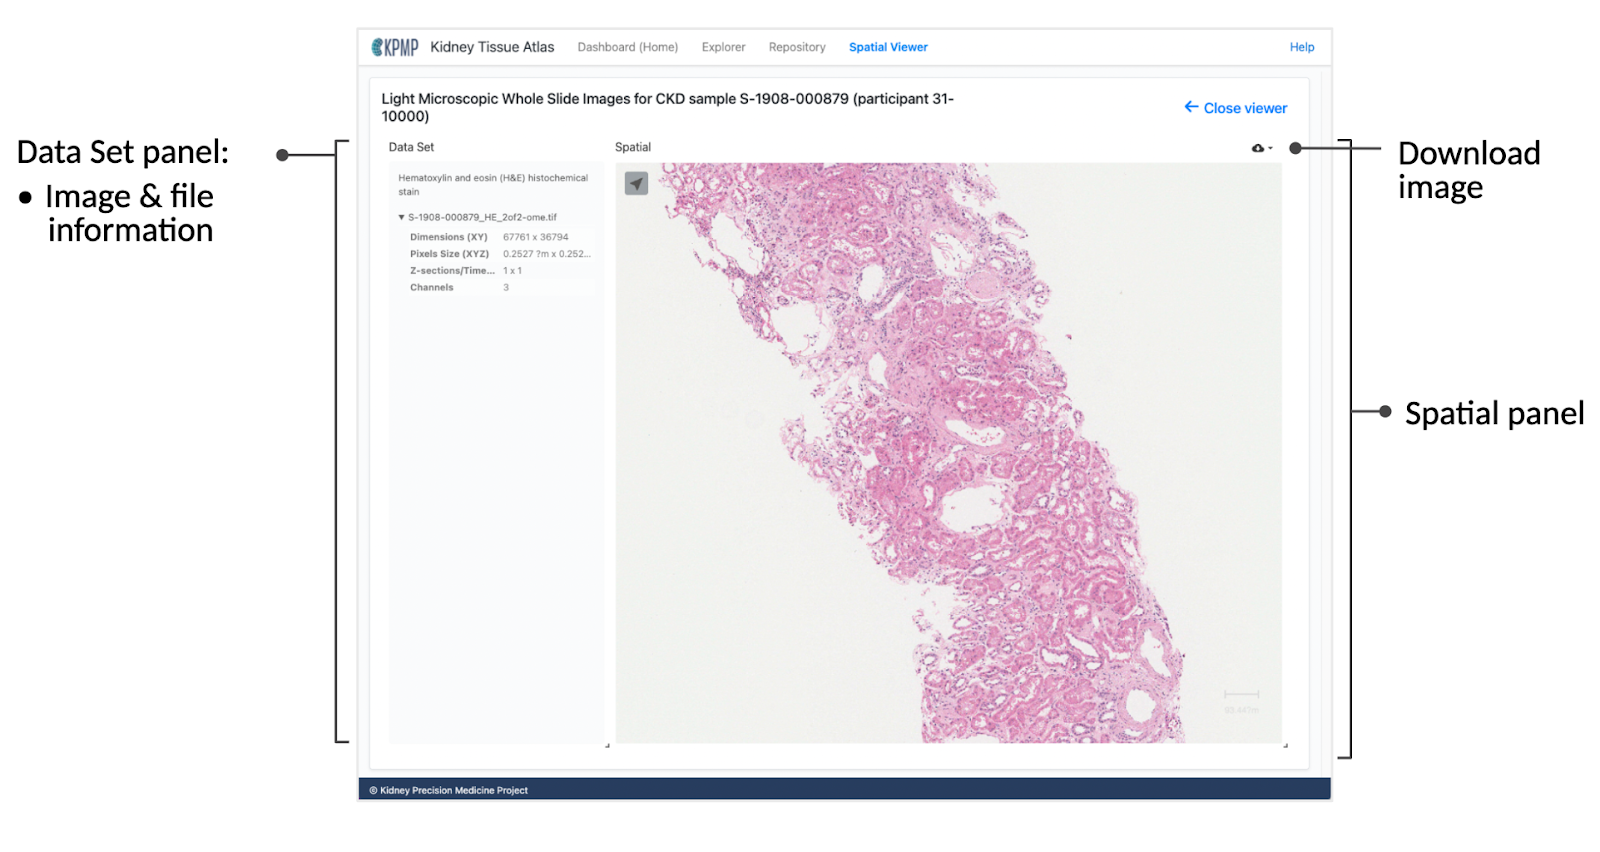
Data Set panel
The Data Set panel on the left displays information on the selected image, including a reiteration of the type of the selected dataset (e.g. “RGB max projection of 8-channel immunofluorescence image volume.”) The Data Set panel also contains additional image information such as X and Y dimension, pixel size, number of channels, etc.
Spatial panel
In the Spatial panel, you can zoom in and out of the image by using the scroll wheel on a mouse or with a trackpad. To download the current image, click on the download icon in the upper-right corner of the Spatial panel.
3D Tissue Imaging and Cytometry
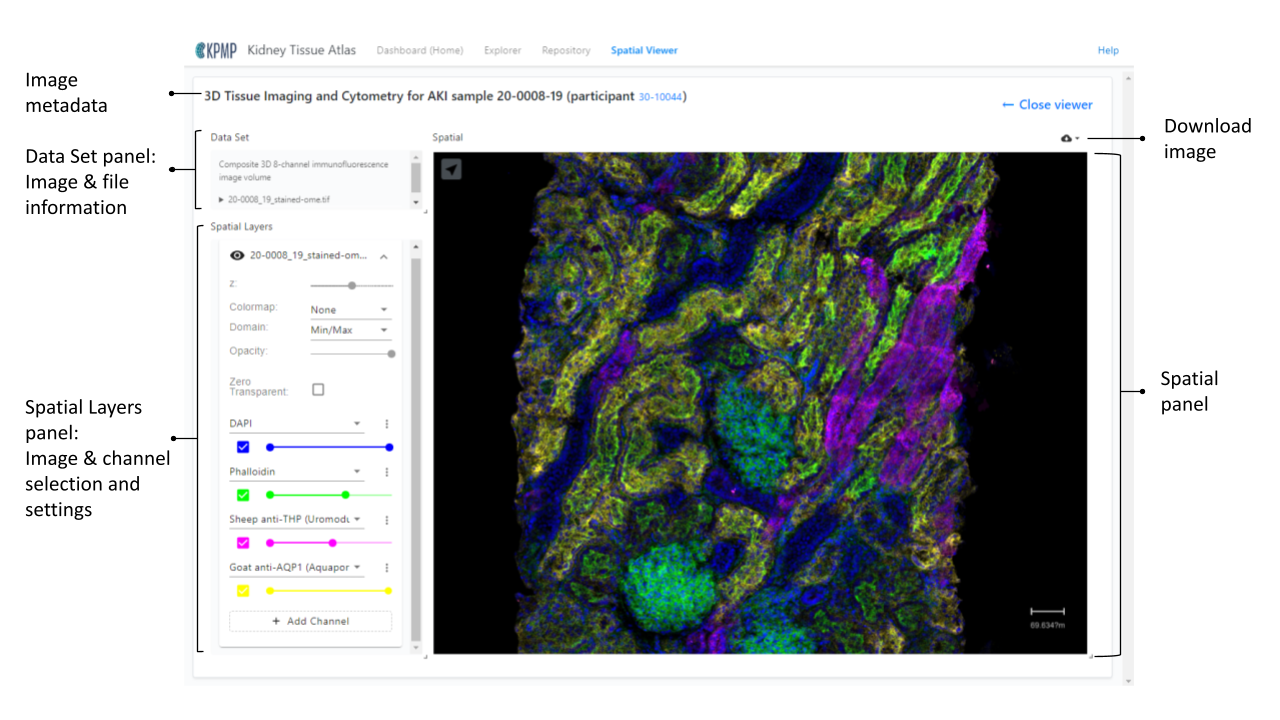
Spatial Layers
For images with multiple channels, a Spatial Layers panel will appear under the Data Set panel. This panel allows you to control which channels appear, designate channel colors, adjust the z axis, and set the opacity of the image.
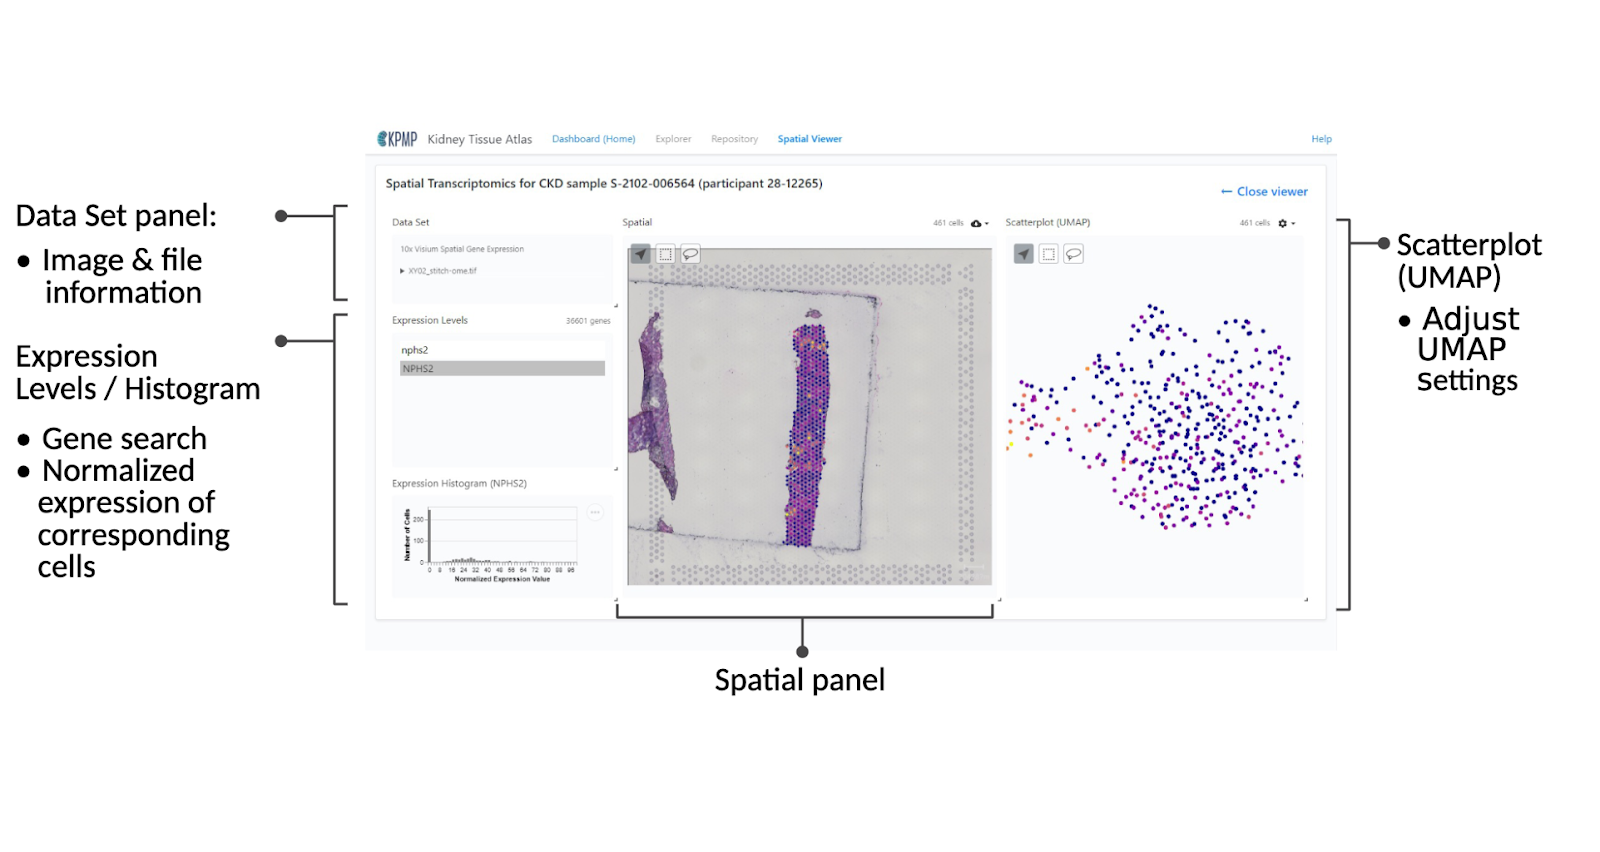
Spatial Transcriptomics
Expression Levels / Espression Histogram
Search for a gene of interest by typing the gene symbol of interest, select it, and the normalized expression level and corresponding number of cells will be graphed below in the Expression Histogram panel. Additionally, the Spatial and Scatterplot components will be updated to show the relative expression levels at different locations on the tissue.
Lassoing/Selecting data
In both the Spatial view and the Scatterplot view, there are a few tools that allow you to select certain points and have them highlight on the other view. This can be especially helpful when looking at the expression levels on the scatterplot. If you see a grouping of spots you can see where they live on the tissue itself by using the lasso or box tool to select the points of interest.
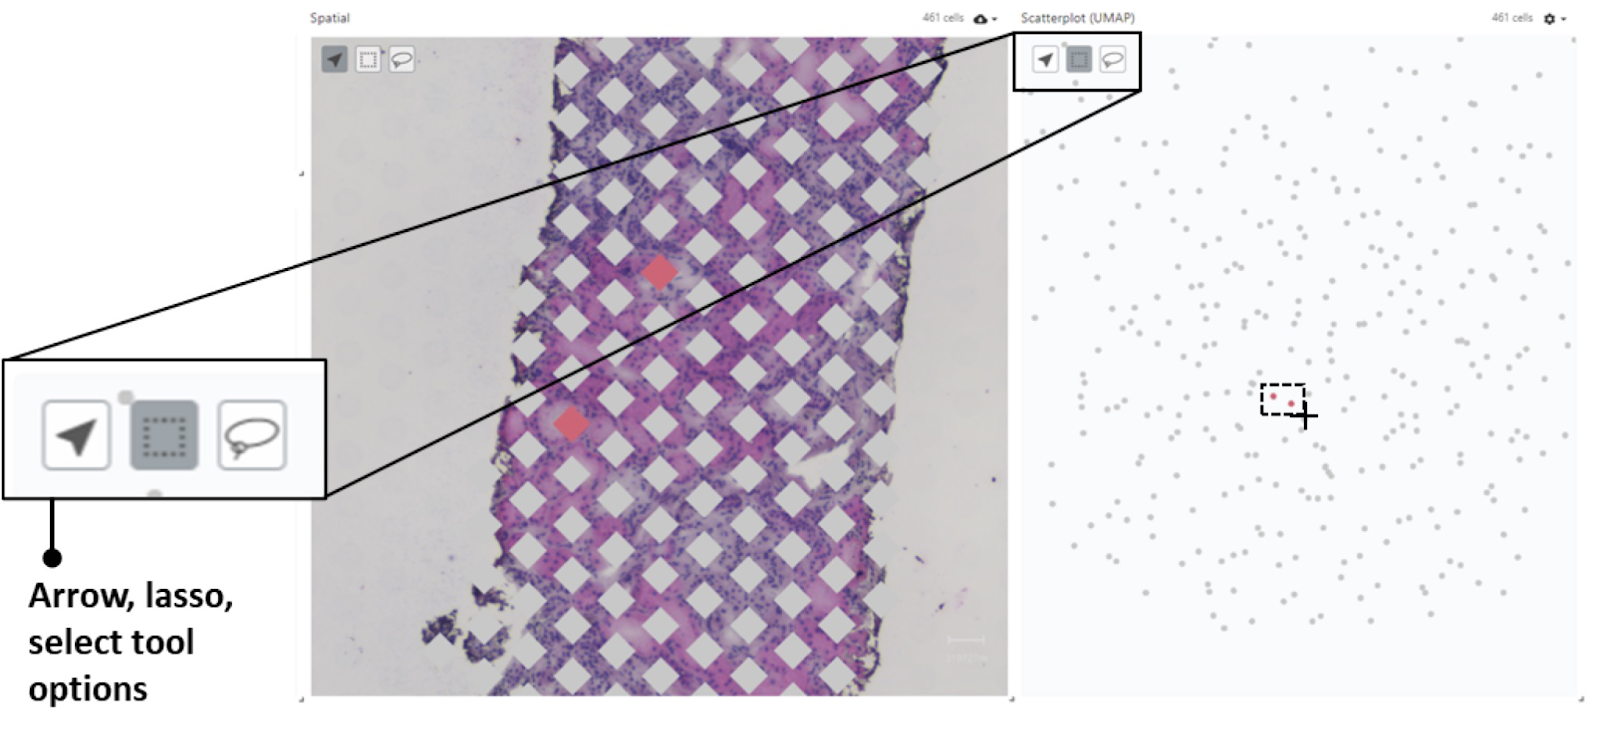
In order to clear your selection, simply reselect the gene of interest from the Expression Levels component on the left.
Search for a gene of interest by typing the gene symbol of interest, select it, and the normalized expression level and corresponding number of cells will be graphed below in the Expression Histogram panel. Additionally, the Spatial and Scatterplot components will be updated to show the relative expression levels at different locations on the tissue.
Spatial panel
The Spatial panel produces a heatmap showing the expression level for the selected gene on the various points on the tissue sample.
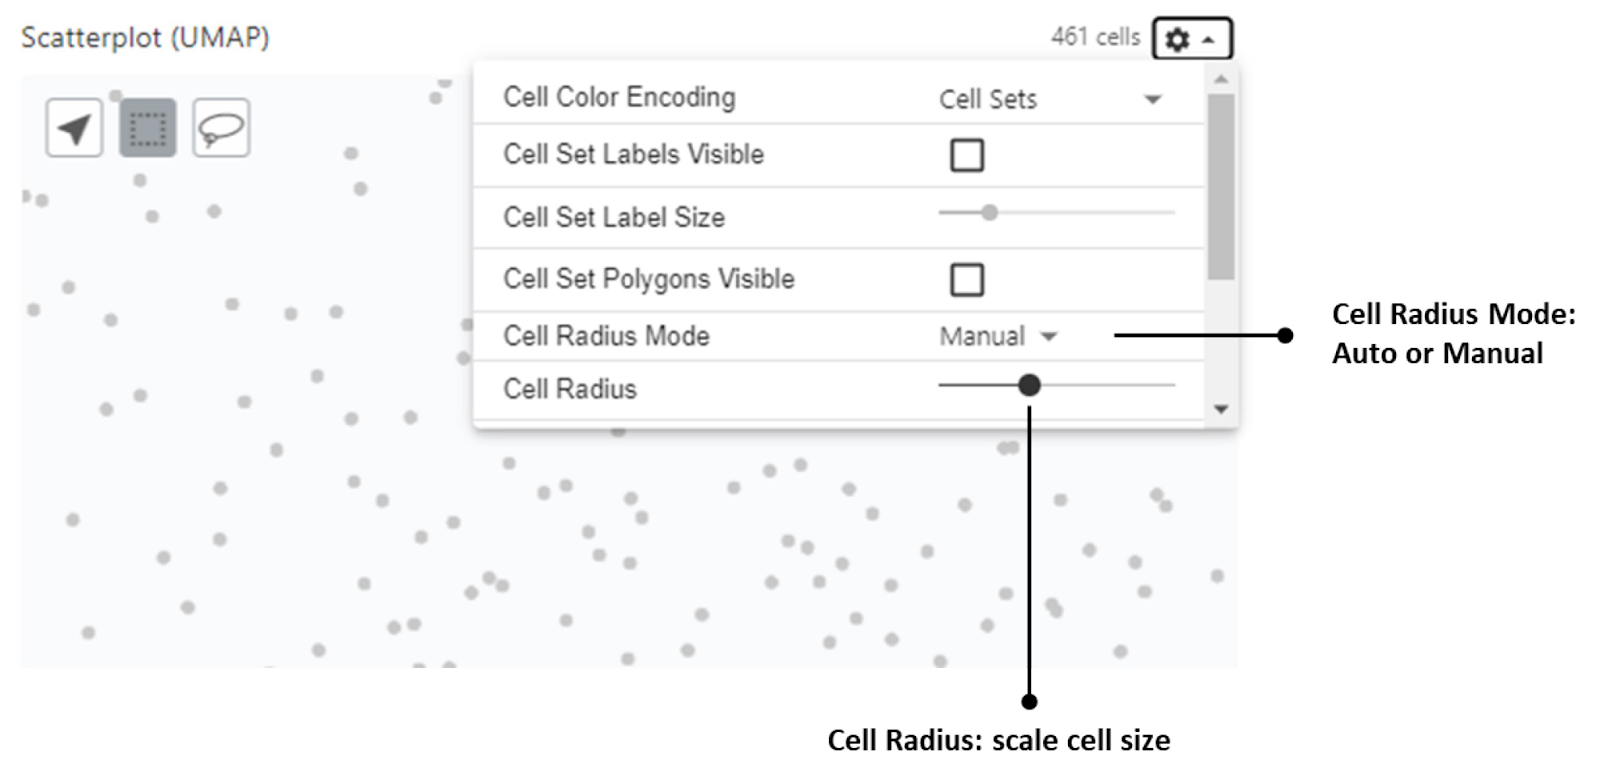
Scatterplot (UMAP) panel
Displays a scatterplot showing gene expression clusters and expression level for the selected gene as a heatmap.
In the Scatterplot (UMAP) you can click the gear icon at the top in order to control a number of attributes on the scatterplot itself. The most useful control we have found is the ability to adjust the radius of the points in the scatterplot. In order to do this, you first change the Cell Radius Mode to Manual, and then you can adjust the slider to adjust the size of the points.
CODEX (CO-DETECTION BY INDEXING)
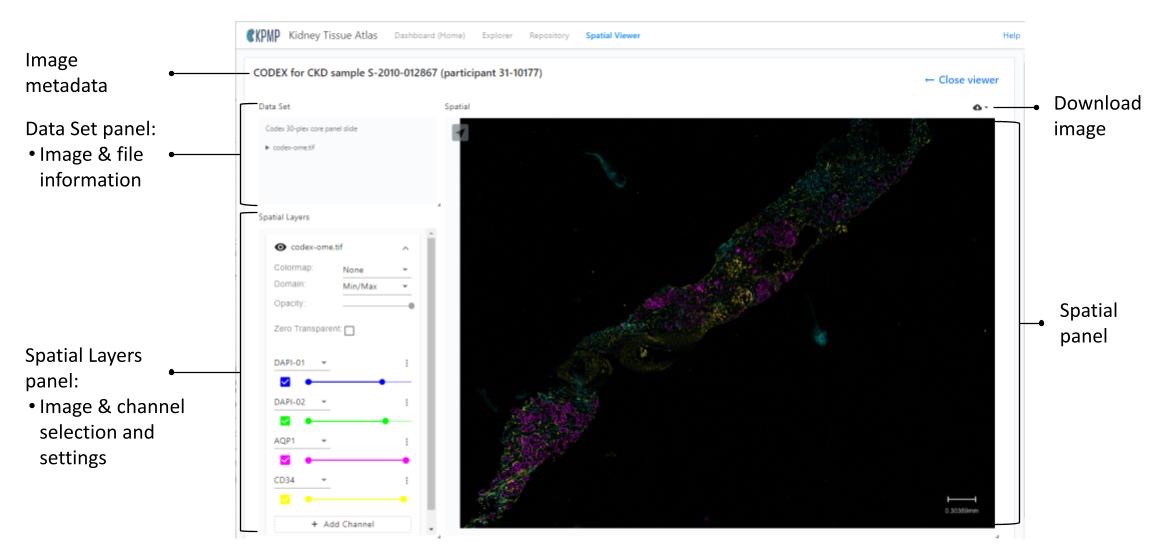
Image metadata
The image metadata on the left conveys the following information specific to the image:
- experimental strategy
- tissue type
- sample ID
- participant ID
Data Set panel
The Data Set panel displays the image information for the image shown in the Spatial panel:
- Image description/type (type)
- file name/type of the downloadable image
Spatial Layers panel
For images with multiple channels, a Spatial Layers panel appears under the Data Set panel. It allows you to add or remove channels, allowing a maximum of six total channels at one time.
Click on the arrow next to the channel / marker name to choose from over 50 markers for the channels. You may also choose from eight different colors for your channels.
Spatial panel
Zoom in and out of the image by using the scroll wheel on a mouse or with a trackpad.
To download the current image, click on the download icon in the upper-right corner of the Spatial panel.
SPATIAL METABOLOMICS, SPATIAL LIPIDOMICS, AND SPATIAL N-GLYCOMICS
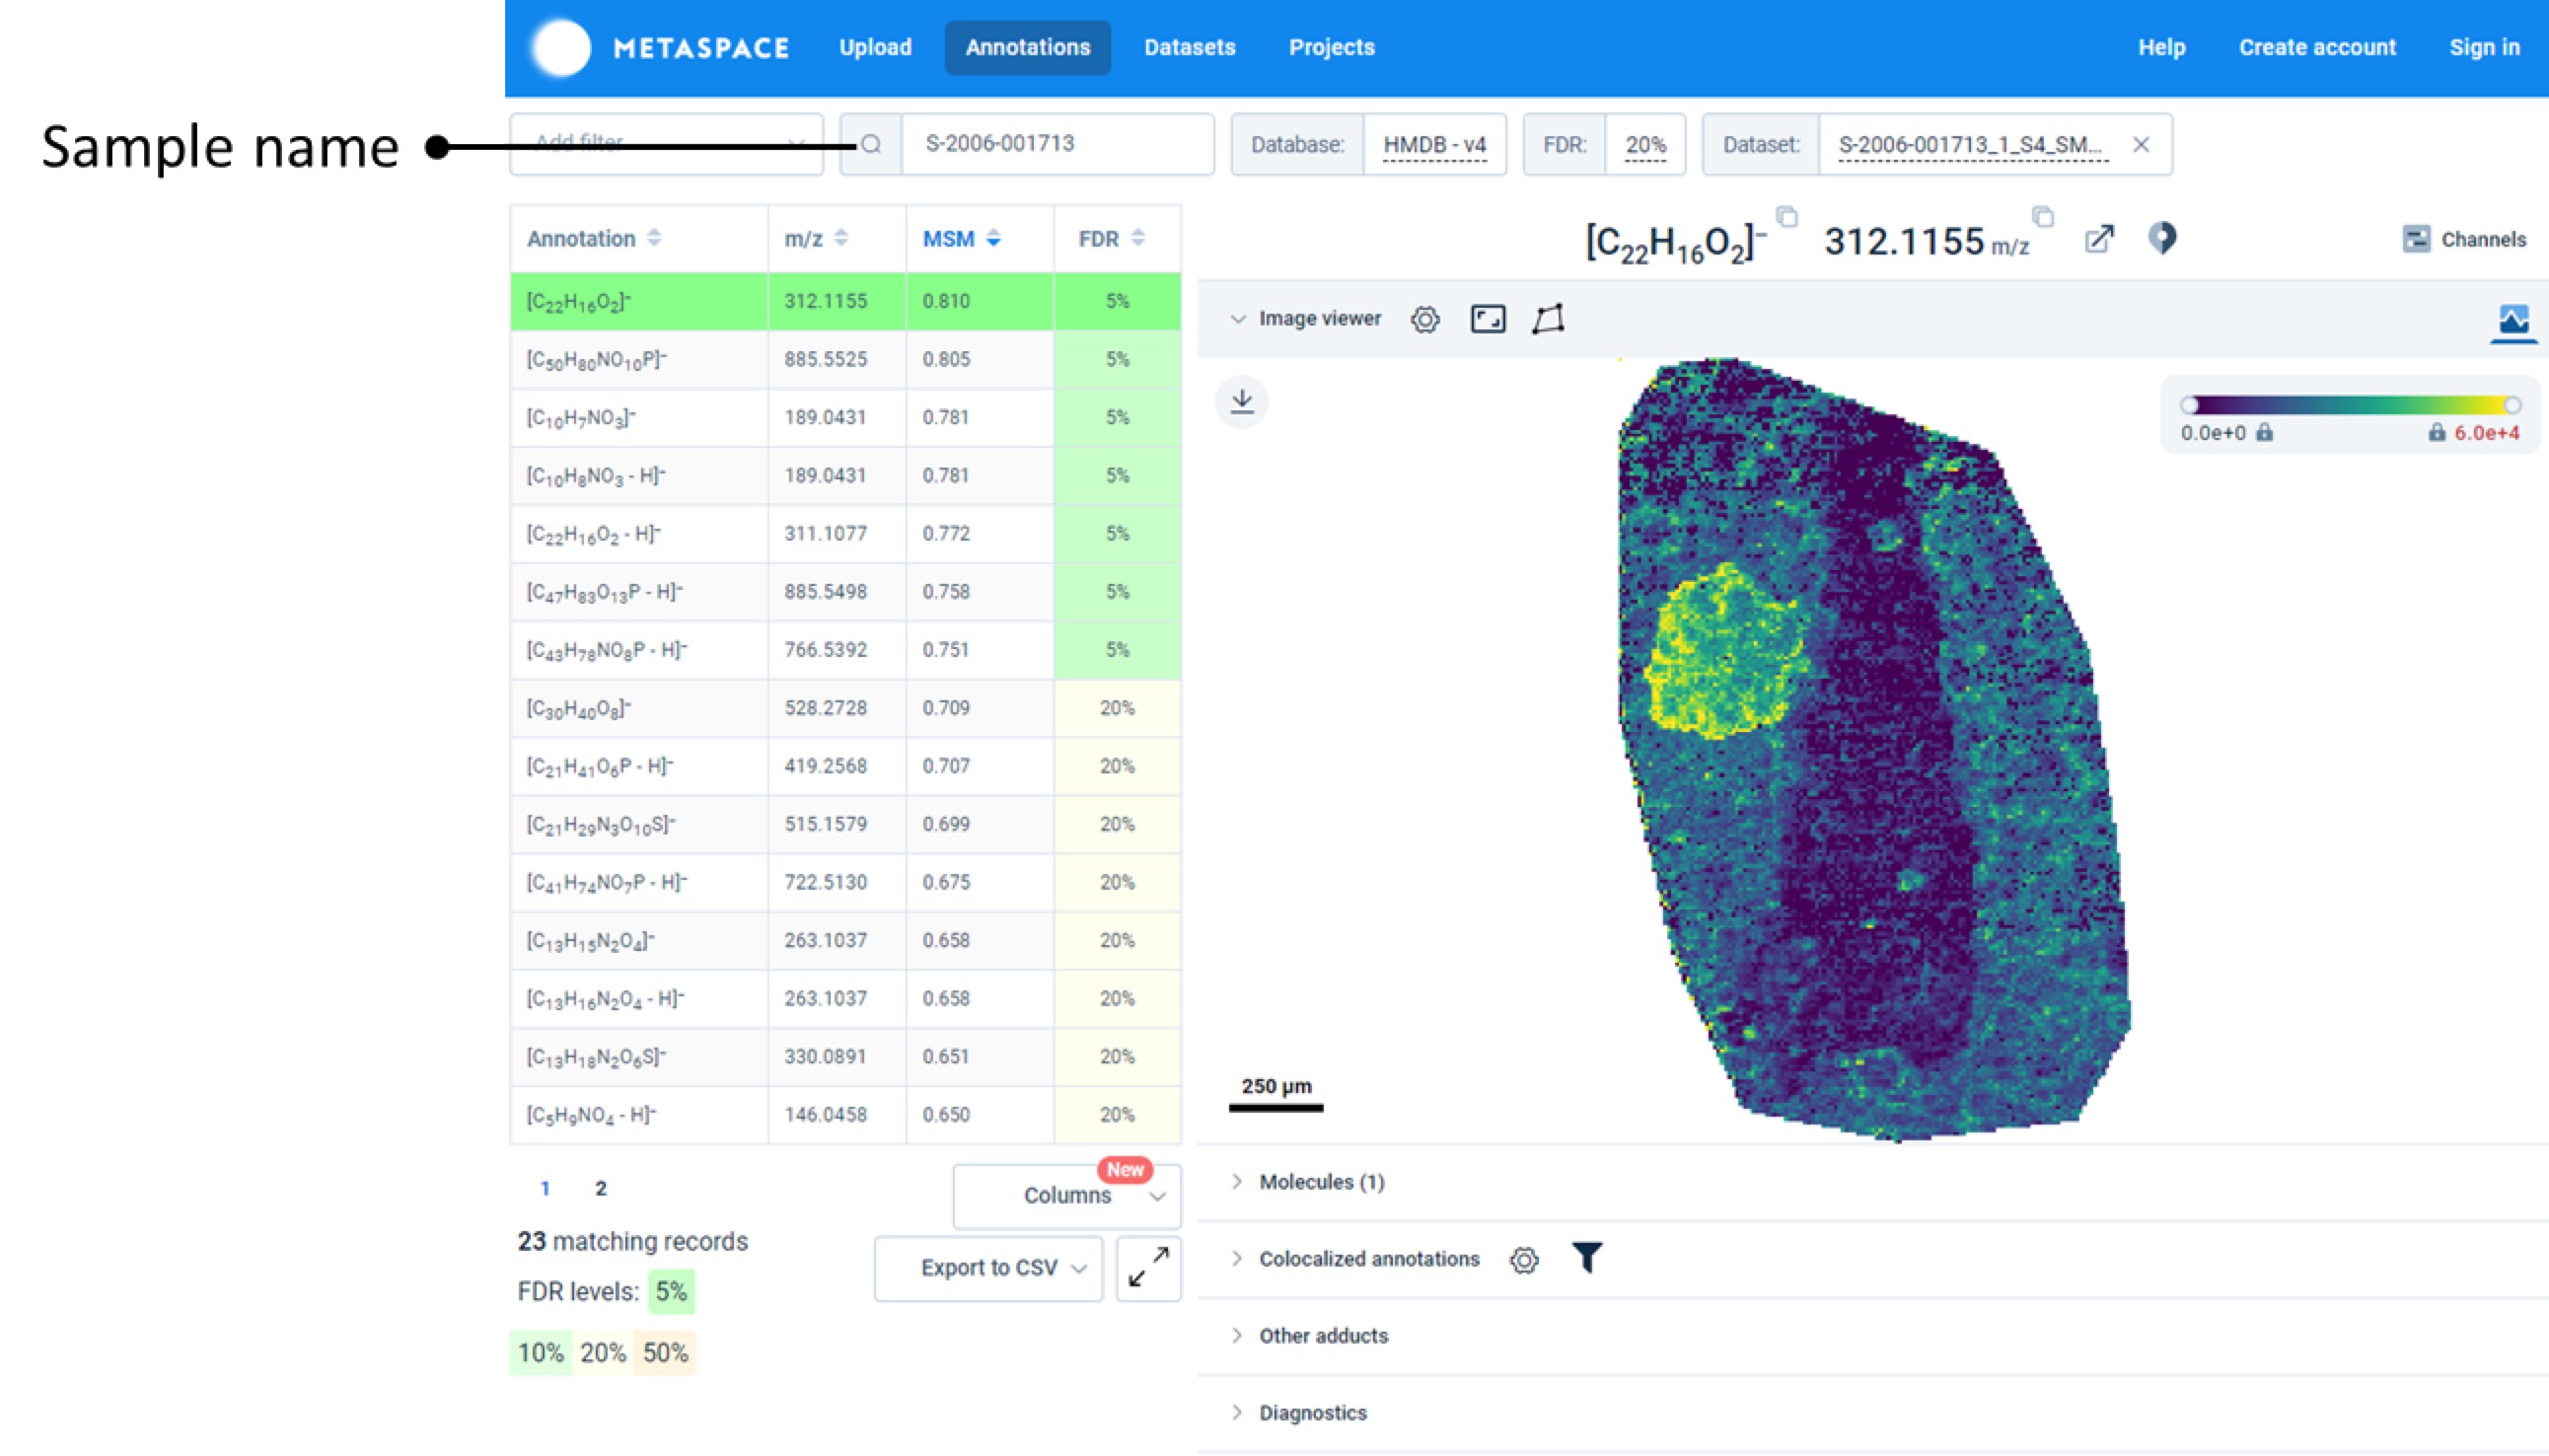
METASPACE
Spatial metabolomics, spatial lipidomics, and spatial N-glycomics data visualizations are available via hyperlinks within the Spatial Viewer to metaspace2020.eu.
Users may select data to view as normal and then follow the active hyperlinks for the appropriate visualizations.
Atlas Ecosystem Releases
Join our mailing list
Q2 2026 KIDNEY TISSUE ATLAS RELEASE
Q2 2026 (v22) EXPLORER RELEASE HIGHLIGHTS
The nephron schematic images in the Atlas Explorer have been upgraded to feature detailed illustrations provided by the Human Reference Atlas. These enhanced visuals offer greater clarity in representing the structure and location of glomerular and tubular cell types. This update reflects our continuing efforts to provide more accurate, informative, and user-friendly resources for the research community.

Additional improvements have been made to our Regional Transcriptomics differential expression tables and their functionality. Gene results are now clearer, with the addition of a comparison column and enhanced gene name hyperlinks that link directly to the relevant comparison, rather than just the overall results page.

Q2 2026 (v22) REPOSITORY AND SPATIAL VIEWER IMPROVEMENTS
We are in the process of updating our filtering to help users better understand how our data is organized and help them get to the information most relevant to defining what they need in the Atlas.
Our first update in this area was to combine the Multimodal Imaging Mass Spectrometry (MALDI-IMS) with the Spatial Lipidomics filter. Now all Spatial Lipidomics data types are under one filter but are differentiated by their Platform.
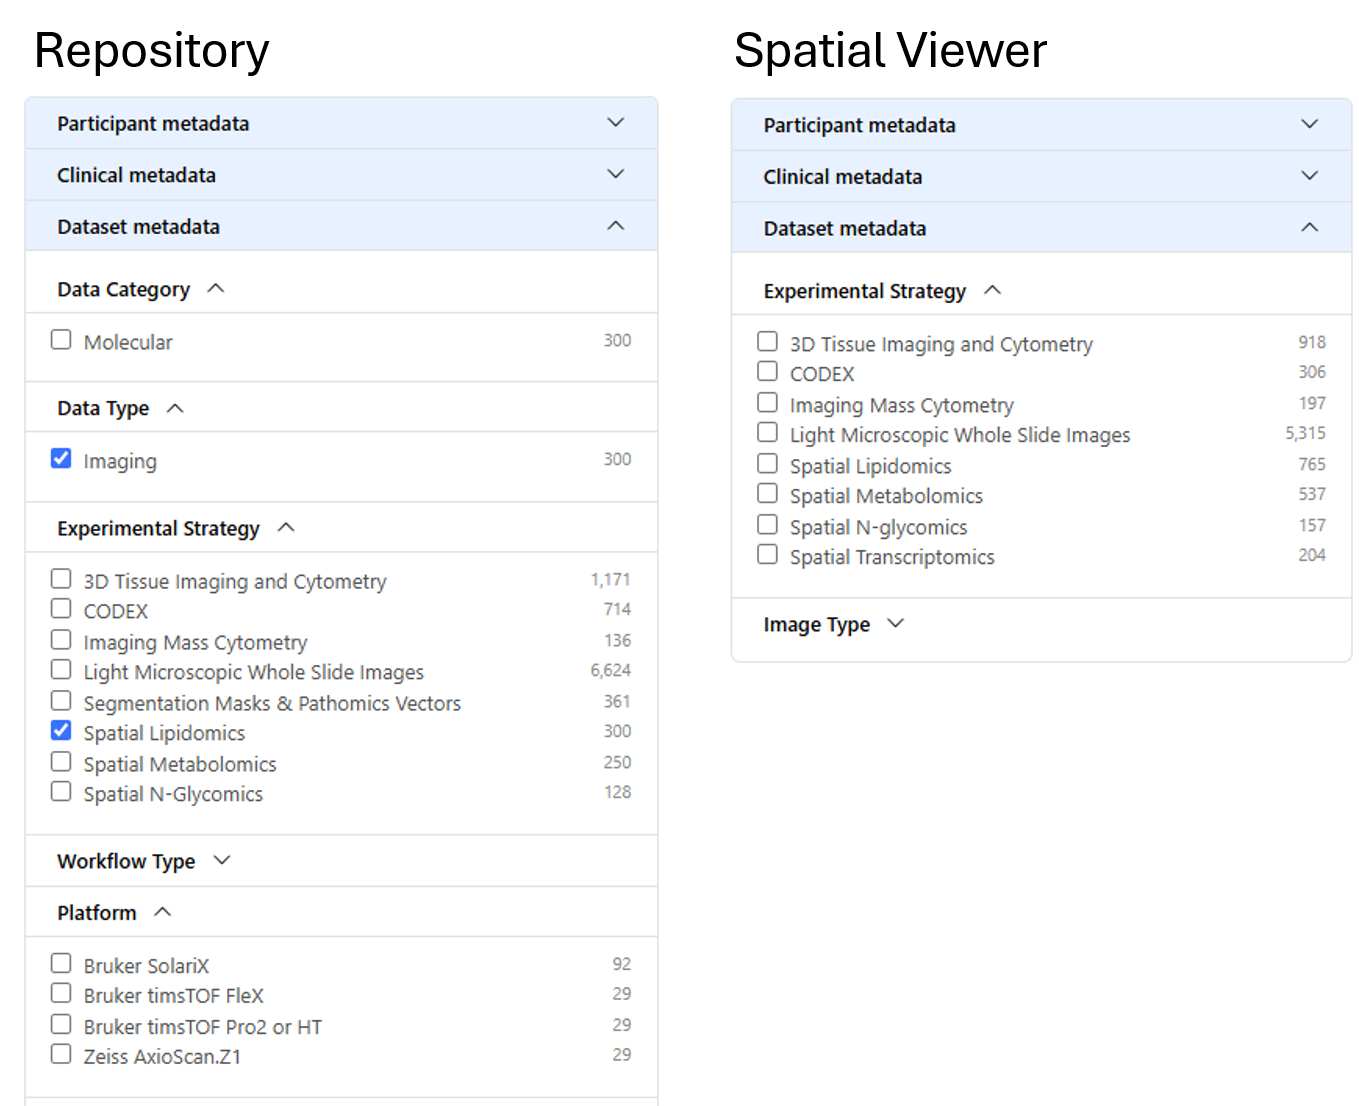
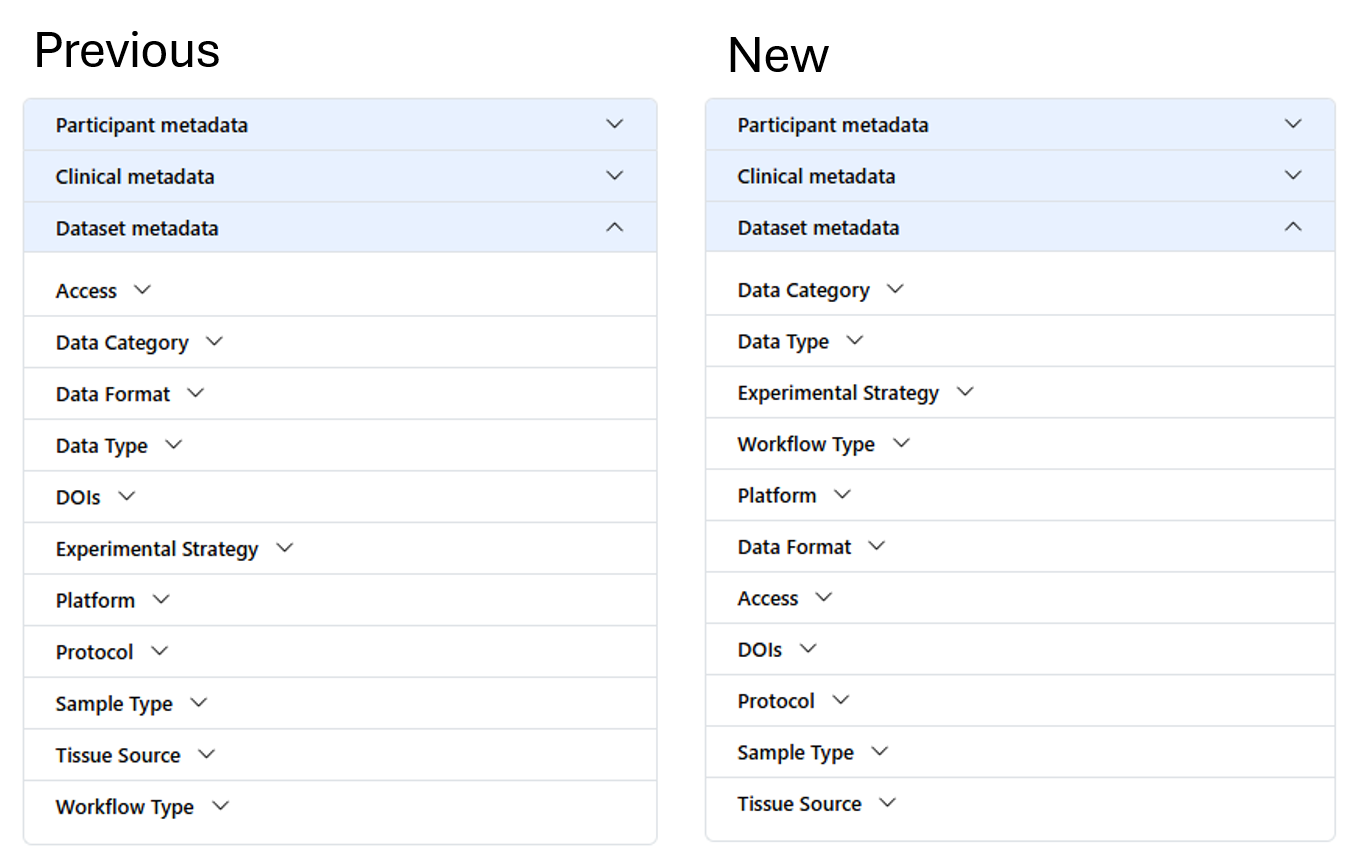
Based on user feedback, we have adjusted the order of elements within the “Dataset metadata” section to provide a more logical sequence for filtering. In the coming months, we will reach out for additional suggestions as we continue to improve the filtering organization and labeling of our available technologies. Thank you to everyone who has provided feedback: we regularly review and assess user suggestions to make the KPMP Atlas a more user-friendly source of information and data access.
Lastly, we incorporated functionality allowing users to right click and open Spatial Viewer images in new tabs. With the addition of this feature, users will be able to take advantage of a feature in Chrome allowing the ability to view two tabs side-by-side.
View video for instructions Using Chrome to view images side-by-side
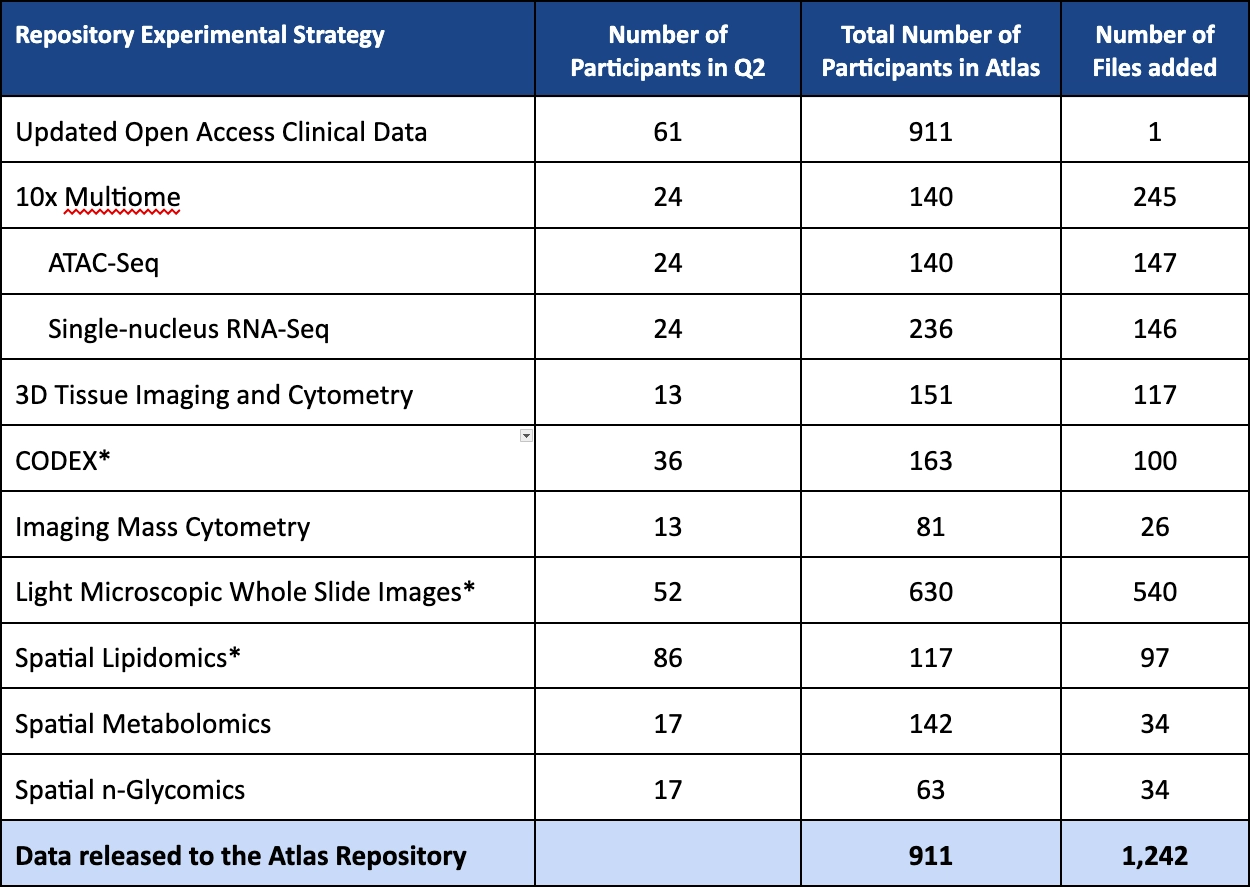
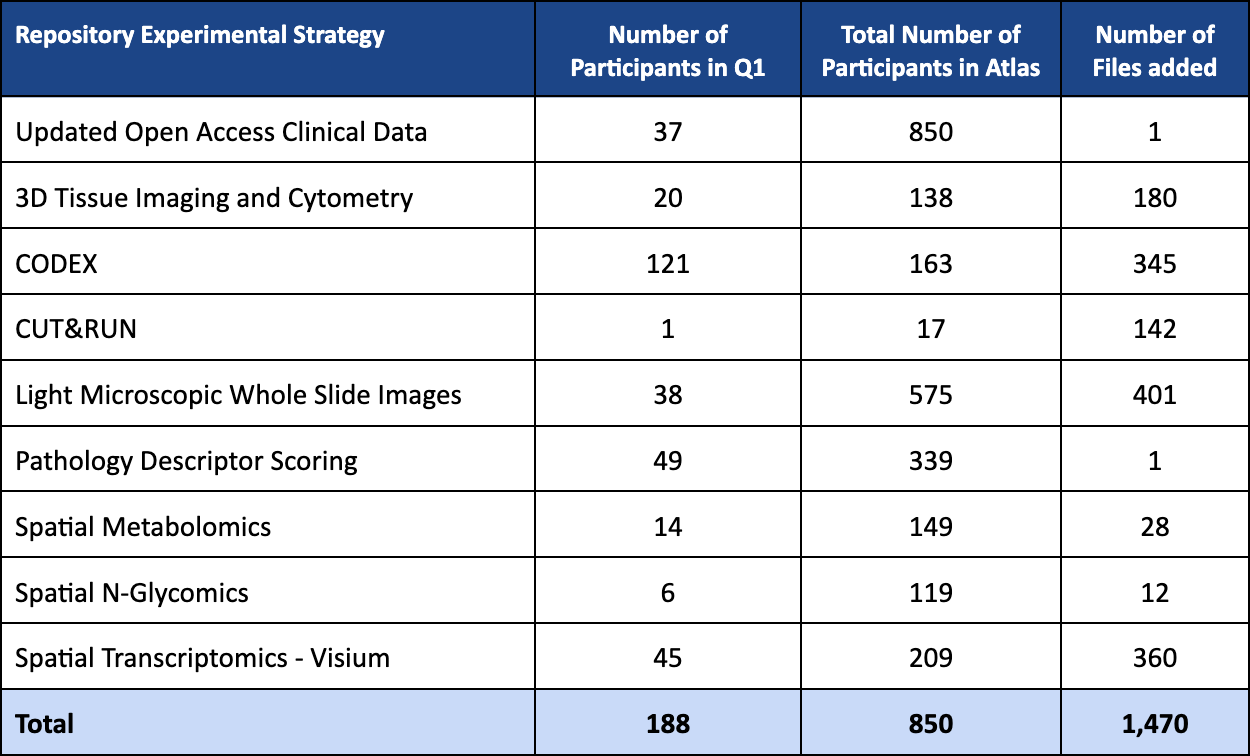
Q2 2026 (v22) REPOSITORY AND SPATIAL VIEWER DATA RELEASE

Q1 2026 KIDNEY TISSUE ATLAS RELEASE
Q1 2026 (v21) EXPLORER RELEASE HIGHLIGHTS
- Addressed duplicate gene results on Regional Transcriptomics Differential Expression page and provided clarity about which comparison set (Glom vs TI or All Regions) the gene appears in.
Q1 2026 (v21) REPOSITORY RELEASE HIGHLIGHTS
- See the Atlas Data Change Log regarding any updates/changes to existing data.
Q1 2026 (v21) SPATIAL VIEWER RELEASE HIGHLIGHTS
- See the Atlas Data Change Log regarding any updates/changes to existing data.
- Minor improvements have been made for some visualizations:
- Moved all navigation to the left side for a consistent experience.
- The Multimodal Imaging Mass Cytometry visualization has been adjusted to provide a similar experience to METASPACE Lipidomics visualizations.

Q4 2025 KIDNEY TISSUE ATLAS RELEASE
Q4 2025 (v20) EXPLORER RELEASE HIGHLIGHTS
- Addressed bug fixes related to Gene Expression Comparison across Cell Clusters tables not appearing for single-cell/single-nucleus RNAseq
Q4 2025 (v20) REPOSITORY RELEASE HIGHLIGHTS
- See the Atlas Data Change Log regarding any updates/changes to existing data
Q4 2025 (v20) SPATIAL VIEWER RELEASE HIGHLIGHTS
- See the Atlas Data Change Log regarding any updates/changes to existing data
Q3 2025 KIDNEY TISSUE ATLAS RELEASE
The Q3 2025 Release of the Kidney Tissue Atlas marks a pivotal moment in our ongoing research endeavors. This highly anticipated release brings groundbreaking updates to our Atlas Explorer and unveils critical new data enhancements within the Atlas Repository.
The Atlas Explorer updates for both Single-cell RNA-seq and Single-nucleus RNA-seq set the stage for the upcoming publication, “Cellular and Spatial Drivers of Unresolved Injury and Functional Decline in the Human Kidney,”, which is now accessible on bioRxiv. This update introduces additional samples and novel cell types, promising to deepen our understanding of kidney disease. More information about associated data can be found in the KPMP Collections page https://doi.org/10.48698/16dd-vj20. KPMP data for this publication may be found in the Atlas Repository by filtering to Dataset metadata/DOIs/10.48698/16dd-vj20.
Importantly, the Atlas Repository now offers Whole Genome Sequence data, available to researchers with a completed Data Use Agreement. A publicly available comprehensive documentation package accompanies this data, providing KPMP participant IDs, file mapping, process guidelines, and quality assurance protocols.
The summaries below offer a snapshot of the remarkable contributions made by our participant heroes, their recruitment sites, and the research laboratories generating the data, highlighting the collective efforts of our entire consortium in advancing kidney disease research.
Q3 2025 (v19) EXPLORER RELEASE HIGHLIGHTS

Q3 2025 (v19) REPOSITORY RELEASE HIGHLIGHTS
%20REPOSITORY%20RELEASE%20HIGHLIGHTS.png)
Q3 2025 (v19) SPATIAL VIEWER RELEASE HIGHLIGHTS
%20SPATIAL%20VIEWER%20RELEASE%20HIGHLIGHTS.png)
Q2 2025 KIDNEY TISSUE ATLAS RELEASE
The KPMP is pleased to announce the Q2 2025 Release of the Kidney Tissue Atlas. The 2022 baseline central laboratory data is being re-released (Plasma Serum Biomarker Data-BC AU5812-2022.v2). This release also includes a wealth of additional biomarker data available from plasma, urine, and stool biospecimens.
The summaries below outline the data in this release, highlighting both the impact in terms of file counts and the participants who contributed to each data type this quarter.
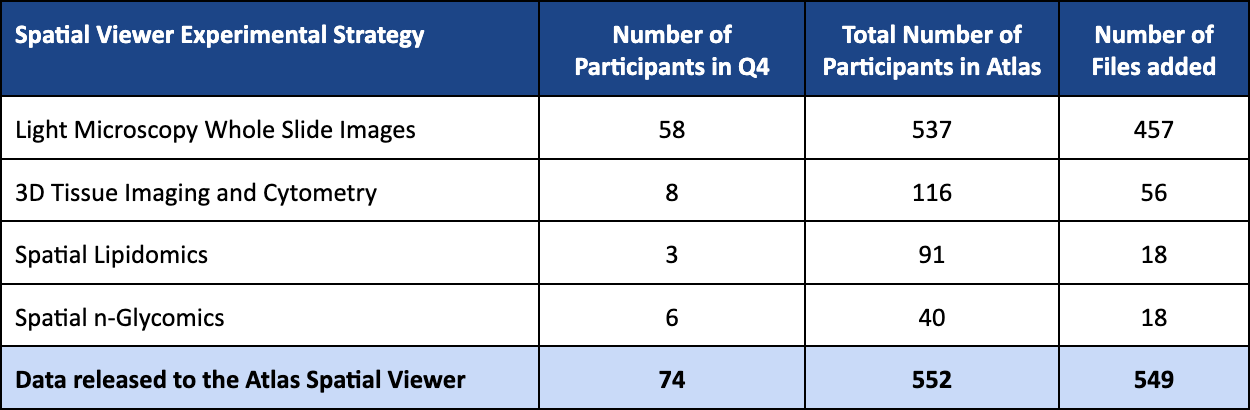
Q2 2025 (v18) SPATIAL VIEWER RELEASE HIGHLIGHTS
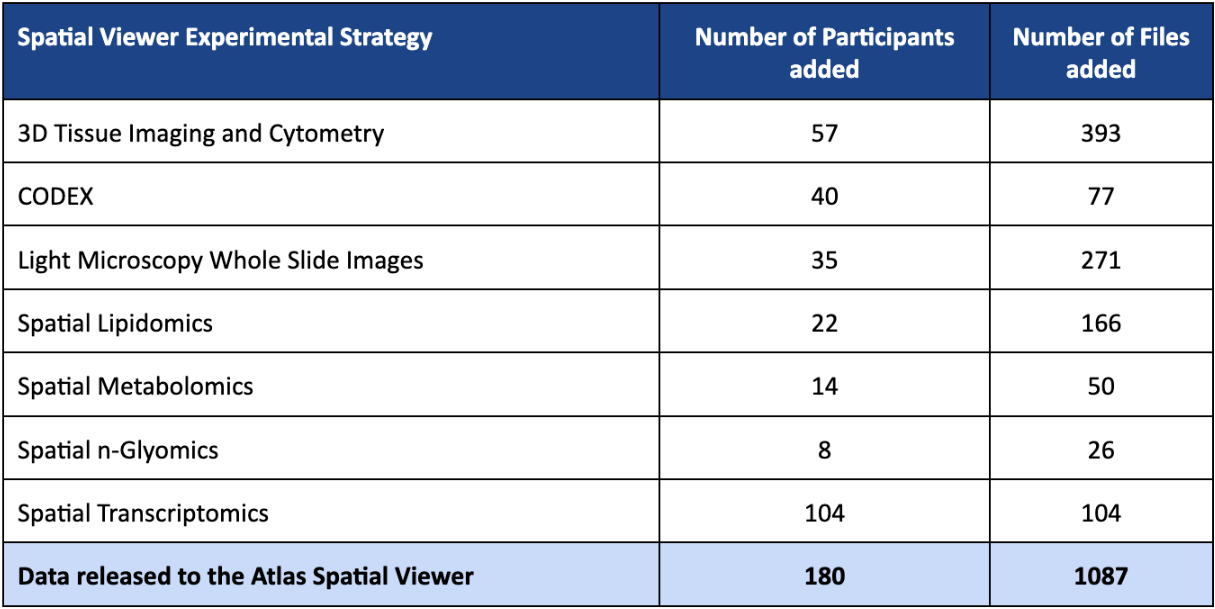
Q2 2025 (v18) REPOSITORY RELEASE HIGHLIGHTS

Q1 2025 (v17) RELEASE HIGHLIGHTS
Data released to the Atlas Repository (1,912):
- 10X Multiome (63)
- ATAC-seq (42)
- Single-nucleus RNAseq (35)
- 3D Tissue Imaging Cytometry (261)
- Biomarker Data (2)
- Metabolon Plasma/Serum (1)
- Metabolon Urine (1)
- Clinical (1)
- CODEX (32)
- Light Microscopy Whole Slide Images (681)
- Multimodal Imaging Mass Spectrometry (88)
- Pathology Descriptor Scoring (1)
- Single-cell RNAseq (255)
- Spatial Transcriptomics (514)
Data released to the Atlas Spatial Viewer (586):
- CODEX (8)
- Light Microscopy Whole Slide Images (520)
- Multimodal Imaging Mass Spectrometry (58)
Q4 2024 (v16) RELEASE HIGHLIGHTS
Software updates:
Experience the improved filtering features in Repository and Spatial Viewer!
The filters panel layout was redesigned and the filter options were expanded, empowering you to effortlessly select data based on attributes from the KPMP publicly available clinical data file.
Now you can easily select data tailored to your specific interests like Primary Adjudicated Category, Baseline eGFR, Diabetes Duration, A1c, and more! Dive in and experience the power of this enhanced functionality:
Data released to the Atlas Repository (874):
- 10X Multiome (75)
- ATAQ-seq (42)
- Single-nucleus RNAseq (47)
- Clinical Data (1)
- CODEX (136)
- CUT&RUN (207)
- Imaging Mass Cytometry (78)
- Light Microscopy Whole Slide Images (252)
- Multimodal Molecular Imaging (40)
- Single-cell RNAseq (25)
- Spatial Lipidomics (6)
- Spatial Metabolomics (40)
Data released to the Atlas Spatial Viewer (446):
- CODEX (34)
- Imaging Mass Cytometry (124)
- Light Microscopy Whole Slide Images (185)
- Spatial Lipidomics (23)
- Spatial Metabolomics (80)
Q3 2024 (v15) RELEASE HIGHLIGHTS
Data released to the Atlas Repository (1,008):
- 10X Multiome (203)
- ATAQ-seq (126)
- Single-nucleus RNAseq (103)
- Clinical Data (1)
- CODEX (24)
- Pathology Descriptor Scoring (1)
- Light Microscopy Whole Slide Images (307)
- Segmentation Masks & Pathomics Vectors (updated) (222)
- Single-cell RNAseq (224)
Data released to the Atlas Spatial Viewer (455):
- CODEX (6)
- Light Microscopy Whole Slide Images (227)
- Segmentation Masks & Pathomics Vectors (222)
Q2 2024 (v14) RELEASE HIGHLIGHTS
Data released to the Atlas Repository (1,277):
- 10X Multiome (17)
- ATAQ-seq (193)
- Single-nucleus RNAseq (137)
- Clinical Data (1)
- CODEX (44)
- CUT & RUN (99)
- Spatial Lipidomics (38)
- Spatial Metabolomics (42)
- Light Microscopy Whole Slide Images (706)
Data released to the Atlas Spatial Viewer (790):
- CODEX (11)
- Spatial Lipidomics (151)
- Spatial Metabolomics (84)
- Light Microscopy Whole Slide Images (544)
Review the Data Change Log for details of specific data changes to any of the Atlas applications.
Software Updates:
- The available data tables on the Atlas home page and the Atlas Explorer home page now include a ALL count of available samples/files.
- The single-cell and single-nucleus RNAseq data now link out to both v1.0 and v1.5 in CELLXGENE.
- Review the Known Issues Tracker for details of specific functionality issues, fixes, and workarounds related to functionality in the Atlas.
- We continue to make minor fixes to our applications that will improve our users’ experience and the security of our data and applications.
Q1 2024 (v13.0)
Data released to the Atlas Explorer (2):
- Single-cell RNA-seq v1.5 (79 samples from 77 participants)
- Single-nucleus RNA-seq v1.5 (80 participants)
Note: these datasets will also be available in CELLxGENE in early April 2024
Data released to the Atlas Repository (388):
- 3D Tissue Imaging and Cytometry (63)
- Clinical Data (1)
- CODEX (104)
- Imaging Mass Cytometry (60)
- Single-cell RNA-seq v1.5 (1)
- Single-nucleus RNA-seq v1.5 (1)
- Spatial Lipidomics (2)
- Spatial Metabolomics (48)
- Spatial N-glycomics (16)
- Whole Slide Images (91)
Data released to the Atlas Spatial Viewer (413):
- 3D Tissue Imaging and Cytometry (115)
- CODEX (26)
- Imaging Mass Cytometry (77)
- Spatial Lipidomics (10)
- Spatial Metabolomics (96)
- Spatial N-glycomics (17)
- Light Microscopy Whole Slide Images (72)
Software Updates:
- Overall
- Minor cosmetic changes have been incorporated across the Atlas.
- “Enrollment Category” has replaced the term “Tissue Type” when referring to enrollment disease cohorts AKI, CKD, DM-R, and Healthy Reference. This change is intended to more easily differentiate how participants are categorized at enrollment in the KPMP study and categorized after the KPMP adjudication process.
- Review the Known Issues Tracker for details of specific functionality issues, fixes, and workarounds.
- Review the Data Change Log for details of specific data changes to any of the Atlas applications.
- Explorer
- Links to CELLxGENE for v1.0 and v1.5 of both Single-cell and Single-nucleus RNA-seq data
- Link to GitHub for Single-nucleus RNA-seq pipelines
- Adjusted p-value has been corrected in the Differential Expression tables for Regional Transcriptomics
- Minor fixes for clarity of content
- Atlas Repository
- Minor display enhancements
February 2024
Data released to the Atlas Repository (3):
- Primary Adjudicated Category
- SomaScan Plasma Proteomics
- SomaScan Urine Proteomics
December 2023 (v12.0)
Data released to the Atlas Repository (972):
- Whole Slide Images (382)
- 3D Tissue Imaging and Cytometry (297)
- 10X Multiome (197) (note that there is some overlap among these files)
- ATAC-Seq (132)
- Single-nucleus RNA-Seq (107)
- Spatial Transcriptomics (39)
- Spatial Lipidomics (11)
- Spatial N-glycomics (2)
- Regional Proteomics aggregated analysis package (1)
- Clinical Data (1)
Data released to the Atlas Spatial Viewer (642):
- Light Microscopy Whole Slide Images (430)
- 3D Tissue Imaging and Cytometry (165)
- Spatial Lipidomics (44)
- Spatial N-glycomics (3)
Software Updates:
- Explorer Regional Proteomics - The Beta visualization of the Regional Proteomics data is now available in the Atlas Explorer. More features will be available for this data type in Q1 2024.
- Help menu - We have updated our Help menu in the upper right of the Atlas to show more detail of what resources are available to users.
- Spatial Viewer - We have updated the Spatial Viewer to the most current version of Vitessce.
October 2023 (v11.0)
Data released to the Atlas Repository (1,721):
- 10X Multiome (193) (note that there is some overlap among these files)
- ATAC-Seq (132)
- Single-nucleus RNA-Seq (99)
- CUT & RUN (143)
- Descriptor Scoring (1)
- DNA Methyl-seq (120)
- Single-cell RNA-Seq (50)
- Biomarker Data: Stool Microbiome Metagenomics (2)
- Regional Proteomics aggregated data package (1)
- Whole Slide Images (579)
- Segmentation Data (222)
- Spatial Lipidomics (34)
- Spatial N-glycomics (18)
- Spatial Transcriptomics (319)
- Clinical Data (1)
Data released to the Atlas Spatial Viewer (615):
- Light Microscopy Whole Slide Images (422)
- Spatial Lipidomics (129)
- Spatial N-glycomics (24)
- Spatial Transcriptomics (40)
Software Updates:
- Repository Participant Information page - This panel, originally featured in the Spatial Viewer and containing participant-specific information (e.g. disease, age, eGFR), is now available in the Atlas Repository with even more information.
- Spatial Viewer Recently Released - In the Spatial Viewer users may now click on the “Recently Released” check box on the File tab to select only those files that are new or updated in the current release.
- Explorer formatting updates -
- Explorer now has a more clearly defined access to CellXGene for users looking for disease-specific differential expression analysis of the KPMP data.
- The format of the gene expression tables has been updated for easier reading
June 2023 (v10.0)
New publications and their associated DOIs:
- KPMP datasets for “Role of endogenous adenine in kidney failure and mortality with diabetes" (Kumar Sharma)
https://doi.org/10.48698/b2xn-d827 - KPMP datasets for "The chromatin landscape of healthy and injured cell types in the human kidney". (Debora L. Gisch, Michael Eadon)
https://doi.org/10.48698/HHE6-YV15
Data released to the Atlas Repository:
- Single-cell RNA-Seq (50)
- Regional Proteomics (118)
- 10X Multiome (188) (note that there is some overlap among these files)
- ATAC-Seq (123)
- Single-nucleus RNA-Seq (99)
- Whole Slide Images (80)
- Opportunity Pool Biomarker Data:
- Plasma Biomarker Data-BC AU5812-2022 (1)
- Urine Biomarker Data-BC AU5812-2022 (includes timed urine information) (1)
- Urine Biomarker Data-UHPLC MS_MS-2022 (includes timed urine information) (1)
- Plasma Biomarker Data-UHPLC MS_MS-2022 ) (1)
- Urine Biomarker Data-BC AU680-2022 (includes timed urine information) (1)
- Spatial Lipidomics (corrected metadata spreadsheet) (1)
- Updated open access clinical data file (includes DM-R) (1)
Data released to the Atlas Spatial Viewer:
- Light Microscopy Whole Slide Images (80)
- Spatial Lipidomics (corrected link) (1)
Software Updates:
- Atlas Repository UI - The Atlas Repository user interface has been updated for consistency across Atlas applications and to allow for future enhancements.
- CSV download - Filter the files you want and create a complete list of the files in a CSV. This will be helpful when making data requests or requesting DOIs be minted and associated with publications. The current CSV file is limited to 1000 rows due to technical issues we will resolve in Q3.
- Diabetes Mellitus - Resilient (DM-R) - The tissue type of “Diabetic Nephropathy Resistor”, which was introduced in Q1 2023 has been relabeled to “Diabetes Mellitus - Resilient” (DM-R) to better reflect this participant group. As you may recall, these participants were originally under the CKD umbrella. You will now see this group addressed in all our filters along with CKD, AKI, and Healthy Reference tissue types.
- File name identifier - The long identifier prefix on file names has been removed for better readability. It is still viewable if you select File UUID from the table column chooser.
- Improved scrolling - Table and filter panel scrolling behavior has been improved for both Spatial Viewer and Repository
- Recently Released - In the Repository you can now click on the “Recently Released” check box on the File tab to select only those files that are new or updated in the current release.
- Participant Portal - Spanish language translation available
MARCH 2023 (v9.0)
ATLAS REPOSITORY
New data available
ATLAS SPATIAL VIEWER
New spatial data available:
- Light Microscopy Whole Slide Images (196)
- Spatial Lipidomics (86)
- Spatial Metabolomics (25)
- CODEX (6)
New feature - Participant Information:
By clicking on the Participant ID, in either the file list or when viewing an image, users will be able to view the Participant Information panel. This panel contains participant-specific information (e.g. disease, age, eGFR) and data available within the Atlas for that specific participant.
Spatial Metabolomics links updated
The links taking users out to METASPACE have been updated to direct users to a summary landing page for the sample selected. From there, users can navigate to the spatial views with detailed annotations of the data by selecting “Browse annotations”.
NOVEMBER, 2022 (v7.0)
ATLAS REPOSITORY
New data available
SEPTEMBER, 2022 (v6.0)
ATLAS SPATIAL VIEWER
New image types available
- Spatial Metabolomics
- Spatial N-glycomics
- Spatial Lipidomics
ATLAS REPOSITORY
Changes to Participant ID display
- When a file contains information for more than one participant, “Multiple participants” will appear in the participant column instead of the list of participants
New data available
JULY, 2022
Atlas Spatial Viewer
New image types available:
- CODEX images for 11 participants
New data available:
- Level added as a data type to be made viewable in the table
- 259 additional Whole Slide Images
Software Applications Help documentation
- Updated to include documentation on the CODEX images.
Atlas Explorer
Improved gene search
- Allows two-letter gene searches.
Please note that some two-letter genes may not show up in the search as there is a cutoff.
Users can also search by known aliases that have more than two letters.
Atlas Data Releases
At KPMP we endeavor to maintain that high quality data be made available to our users. In this effort we will occasionally come across data that we have found requires it to be pulled back from the repository or replaced with corrections. We work closely with those that originally supplied the data to ensure not only that the data is replaced but that we also supply information as to why the data was pulled back or replaced.
Have you run into an issue with KPMP data not reported here? Please report issues through our Give us your feedback link (above).
Atlas Known Issues
The KPMP Atlas software team acknowledges that the tools may not always work ideally or the same from browser to browser. We want to acknowledge these issues for users and, if possible, provide potential workarounds until these issues can be resolved.
Have you run into an issue not reported here? Please report issues through our Give us your feedback link (above).
The KPMP Data Visualization Center (DVC) has developed a variety of internal and external applications to support the gathering, integration, and display of the data generated through this project. All software is freely accessible from our KPMP GitHub page.