Atlas Spatial Viewer
View and explore spatial datasets such as whole slide images, 3D imaging, and spatial transcriptomics.
The following data types have been incorporated into the Atlas Spatial Viewer:
- Light Microscopic Whole Slide Images
- 3D Tissue Imaging and Cytometry
- Spatial Transcriptomics
- CODEX
- Spatial Metabolomics
For more details on these spatial technologies, refer to the Technologies help documentation under Imaging and Metabolomics.
The data available in the Spatial Viewer are routinely added as they are generated and quality checked. A summary of the data available in the Spatial Viewer can be found on the Kidney Tissue Atlas homepage.
The spatial images presented in the application have been pre-processed in order to convert them to OME (Open Microscopy Environment) TIFF (tagged image file format) using Bio-Formats bftools version 5.8.
Each dataset is identified by a sample ID, which is derived from a segment of a participant's biopsy tissue. Every sample ID may be traced back to a single participant ID.
NAVIGATION
The Atlas Spatial Viewer allows you to search the available KPMP spatial datasets by data-level and participant-level attributes and visualize the associated datasets.

DATASET LIST
Filter panel
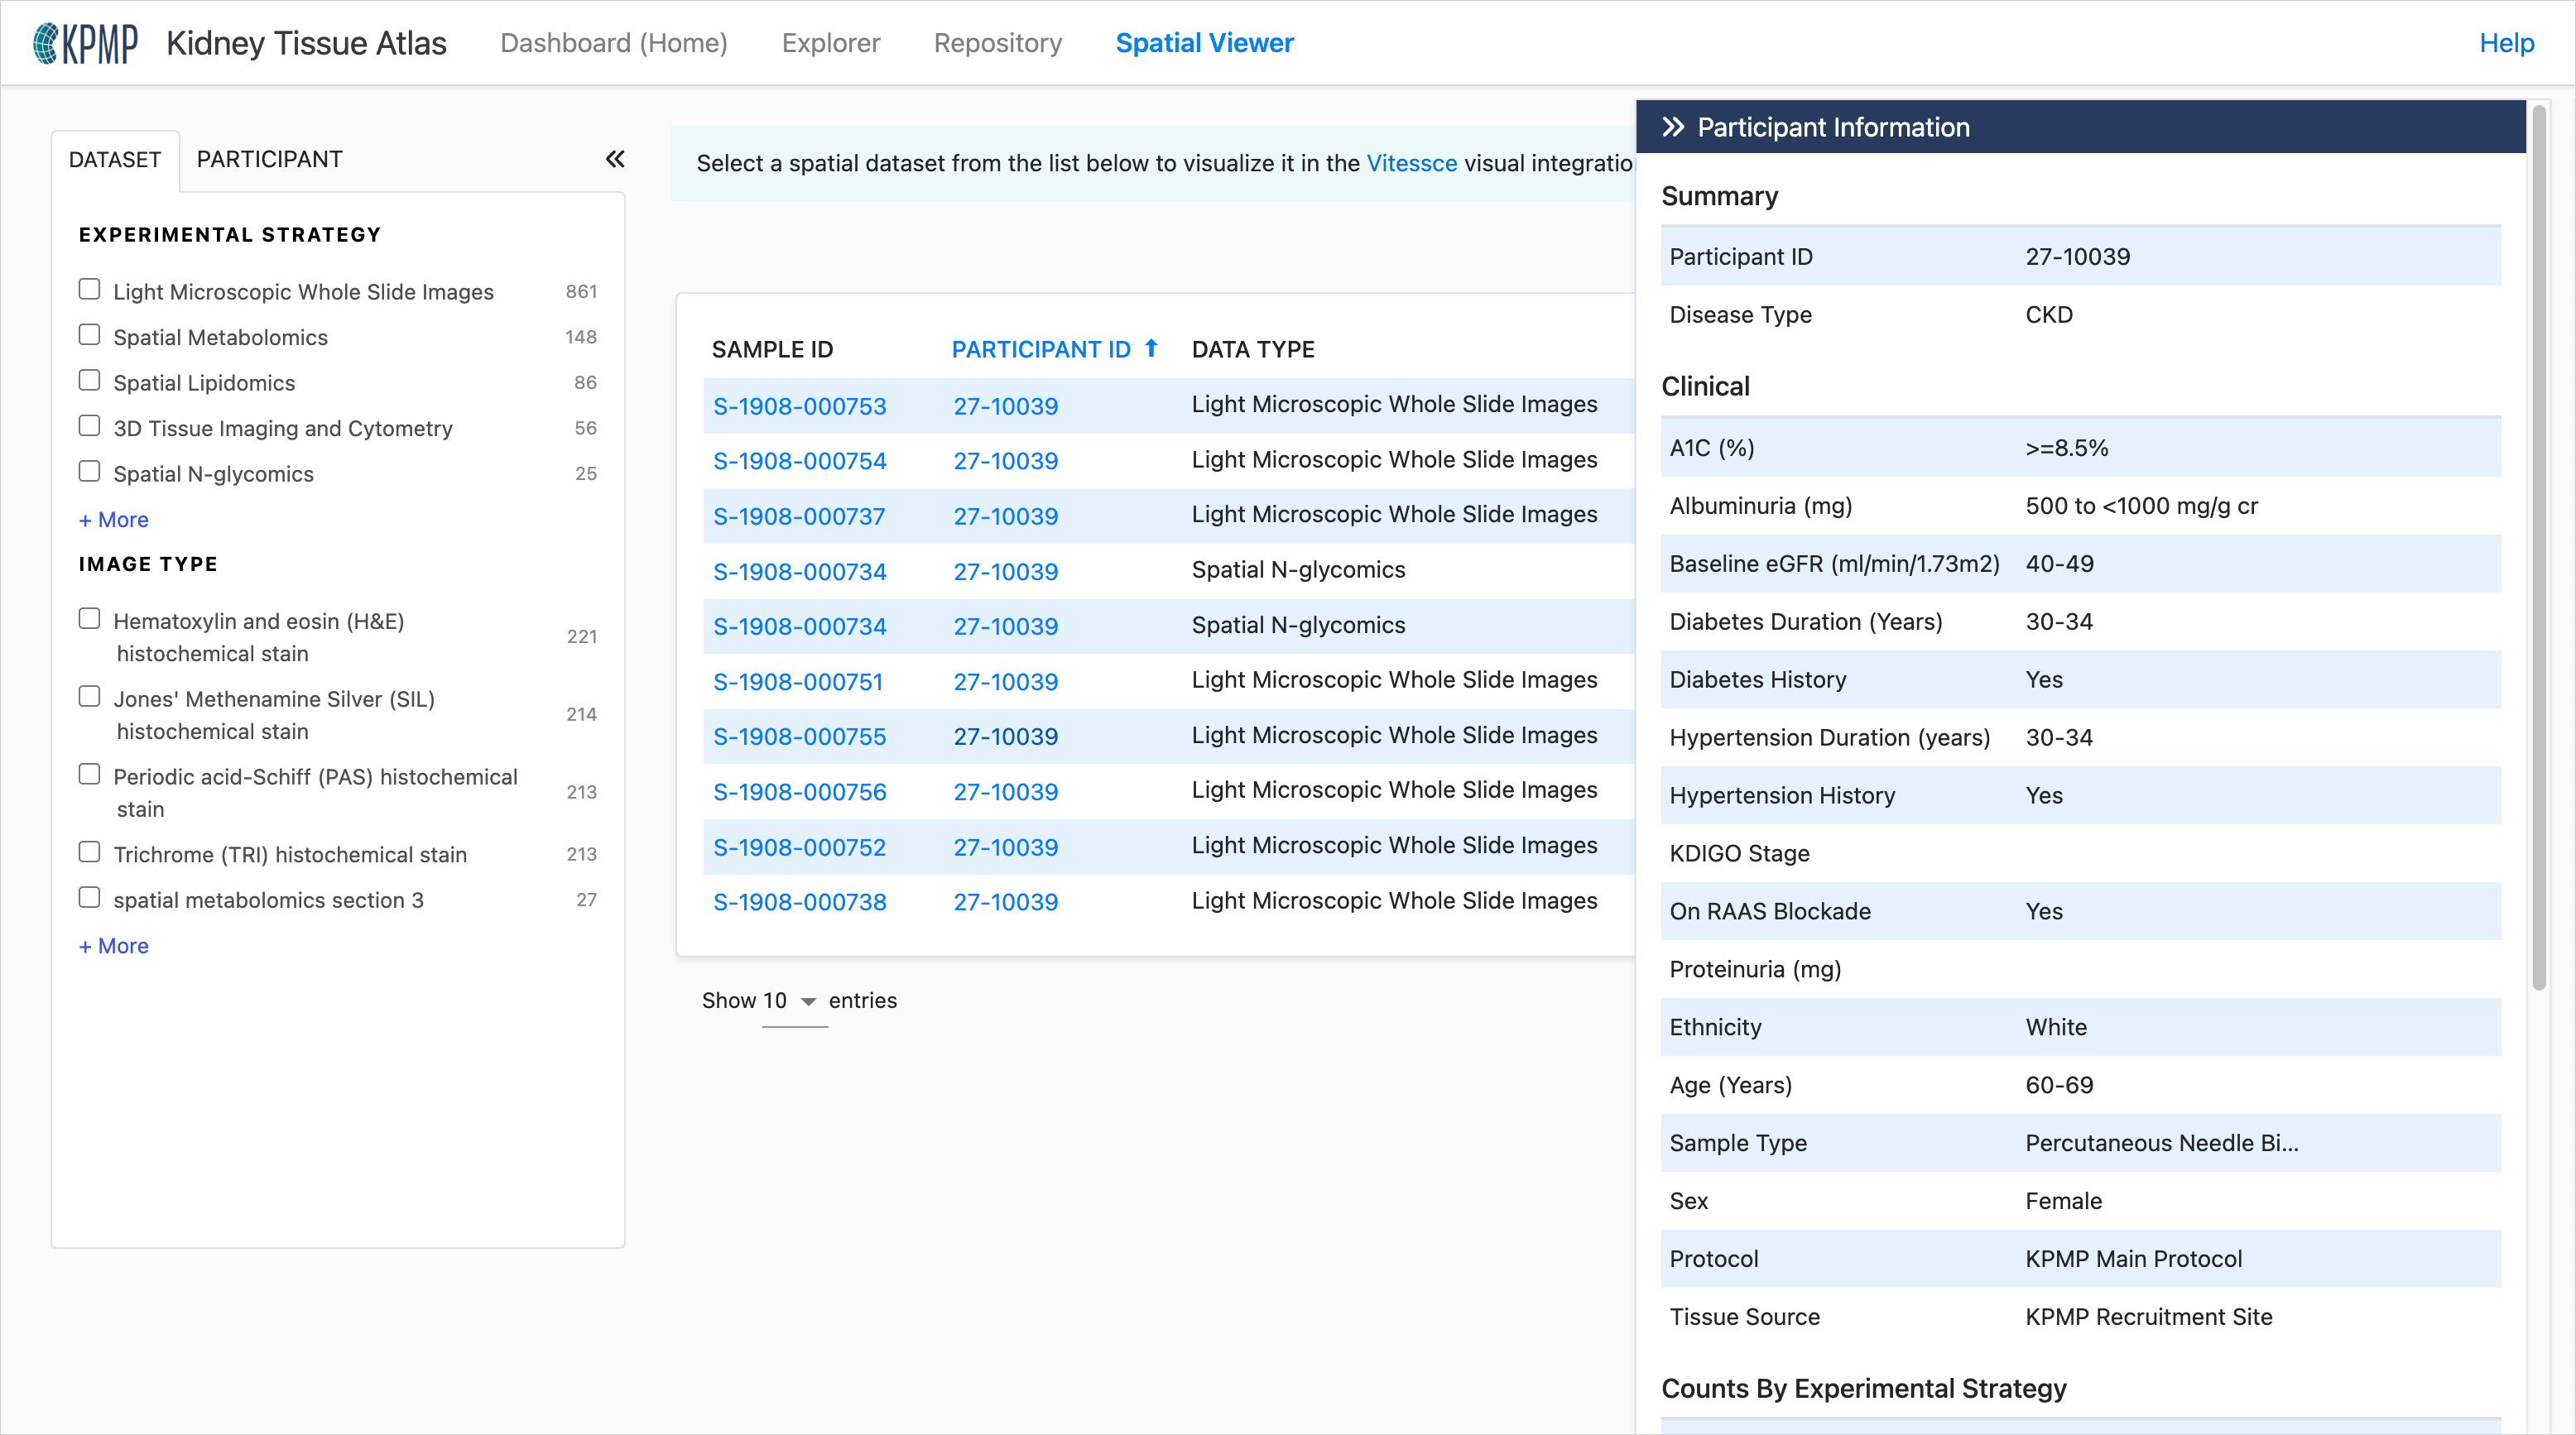
Narrowing your search to a focused selection of datasets is accomplished using the filter panel on the left-hand side of the screen. The filter panel is divided in two tabs, DATASET and PARTICIPANT, with each tab containing attributes by which to filter the dataset list to the right of the filter panel.
Participant-level filters allow searching for datasets that contain particular participant-level attributes such as age range, tissue type, etc. Dataset-level filters allow a user to search for different types of datasets (Light Microscopy vs 3D Cytometry).
To open a dataset in the viewer, click on the link in the SAMPLE ID column.
Sorting and resizing columns
Click on a column heading to sort the data in the column ascending order. Click on the column header a second time to sort in descending order.
When hovering over the column heading you will see a blue line that appears at the right hand side of the column. Click and drag the blue line to increase or decrease the column width.
Showing/hiding columns
By default the dataset list displays the SAMPLE ID, DATA TYPE, and IMAGE TYPE columns. Click the left button at the top of the dataset list and a field chooser will appear which allows you show additional columns or hide the active columns. NOTE:e SAMPLE ID column cannot be hidden.
Participant information panel
Click on the Participant ID in the dataset list or when viewing an image to view the Participant Information panel. This panel contains clinical information (e.g. disease, age, eGFR) and data available within the Atlas for the selected participant.
VISUALIZATIONS
The Spatial Viewer uses the Vitessce visualization platform as its visualization engine. The layout and features/functionality of the visualization page will be specific to the data type selected.
Light Microscopic Whole Slide Images
Data Set panel
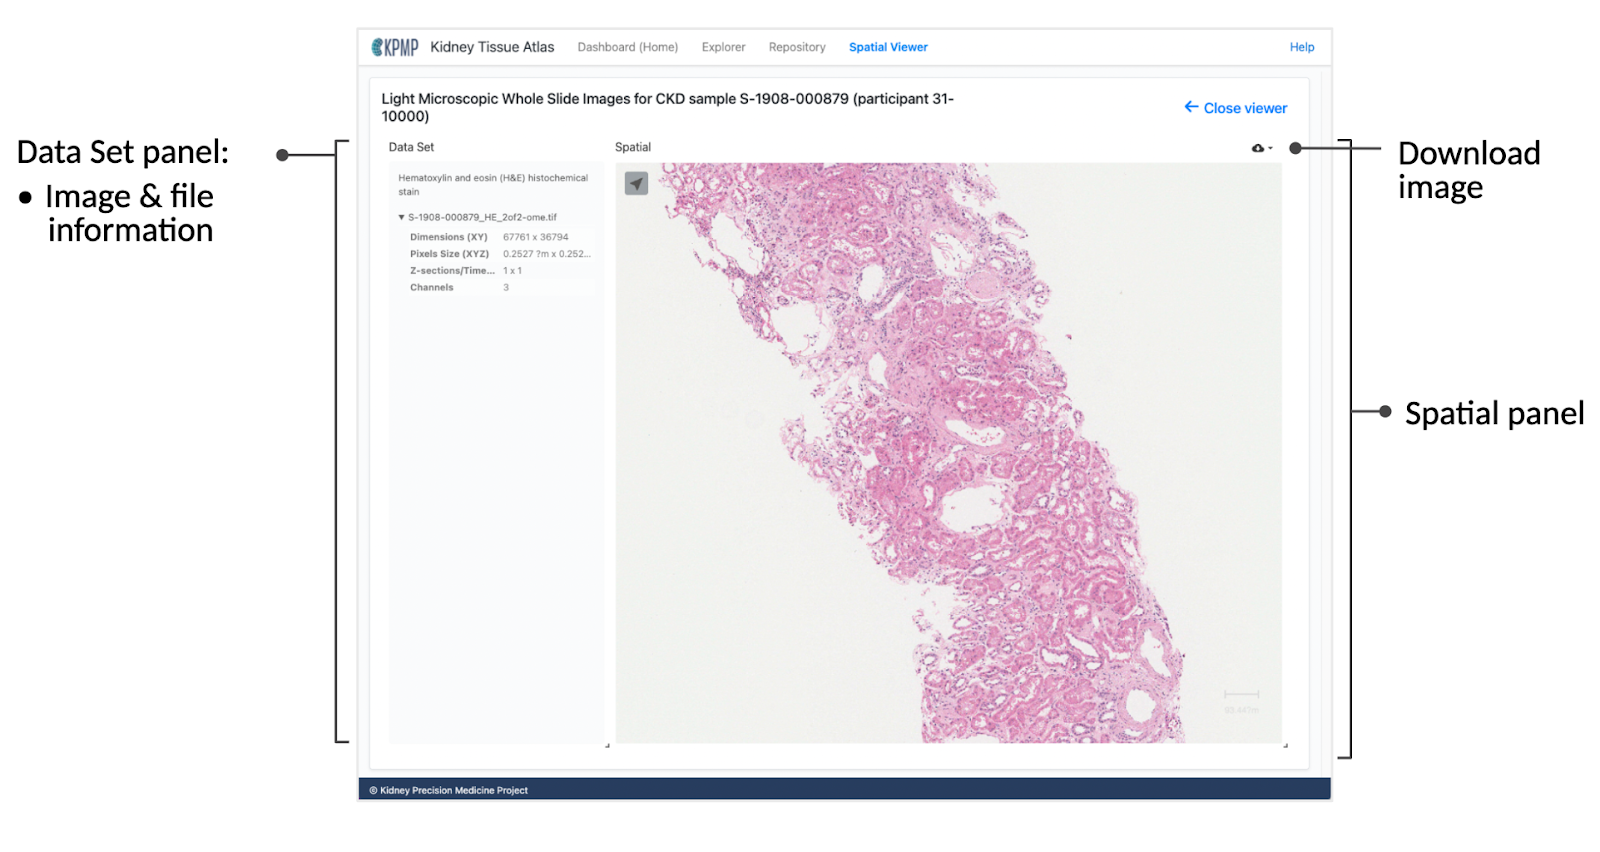
The Data Set panel on the left displays information on the selected image, including a reiteration of the type of the selected dataset (e.g. “RGB max projection of 8-channel immunofluorescence image volume.”) The Data Set panel also contains additional image information such as X and Y dimension, pixel size, number of channels, etc.
Spatial panel
In the Spatial panel, you can zoom in and out of the image by using the scroll wheel on a mouse or with a trackpad. To download the current image, click on the download icon in the upper-right corner of the Spatial panel.
3D Tissue Imaging and Cytometry
Spatial Layers
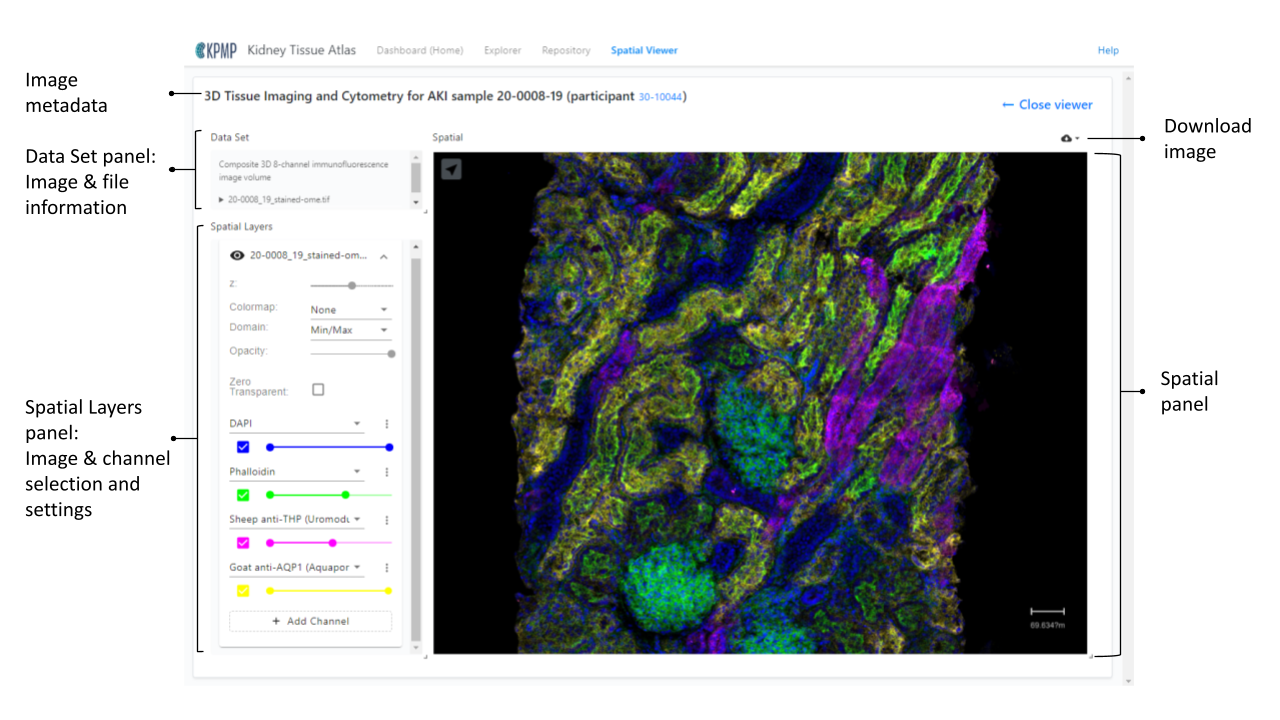
For images with multiple channels, a Spatial Layers panel will appear under the Data Set panel. This panel allows you to control which channels appear, designate channel colors, adjust the z axis, and set the opacity of the image.
Spatial Transcriptomics
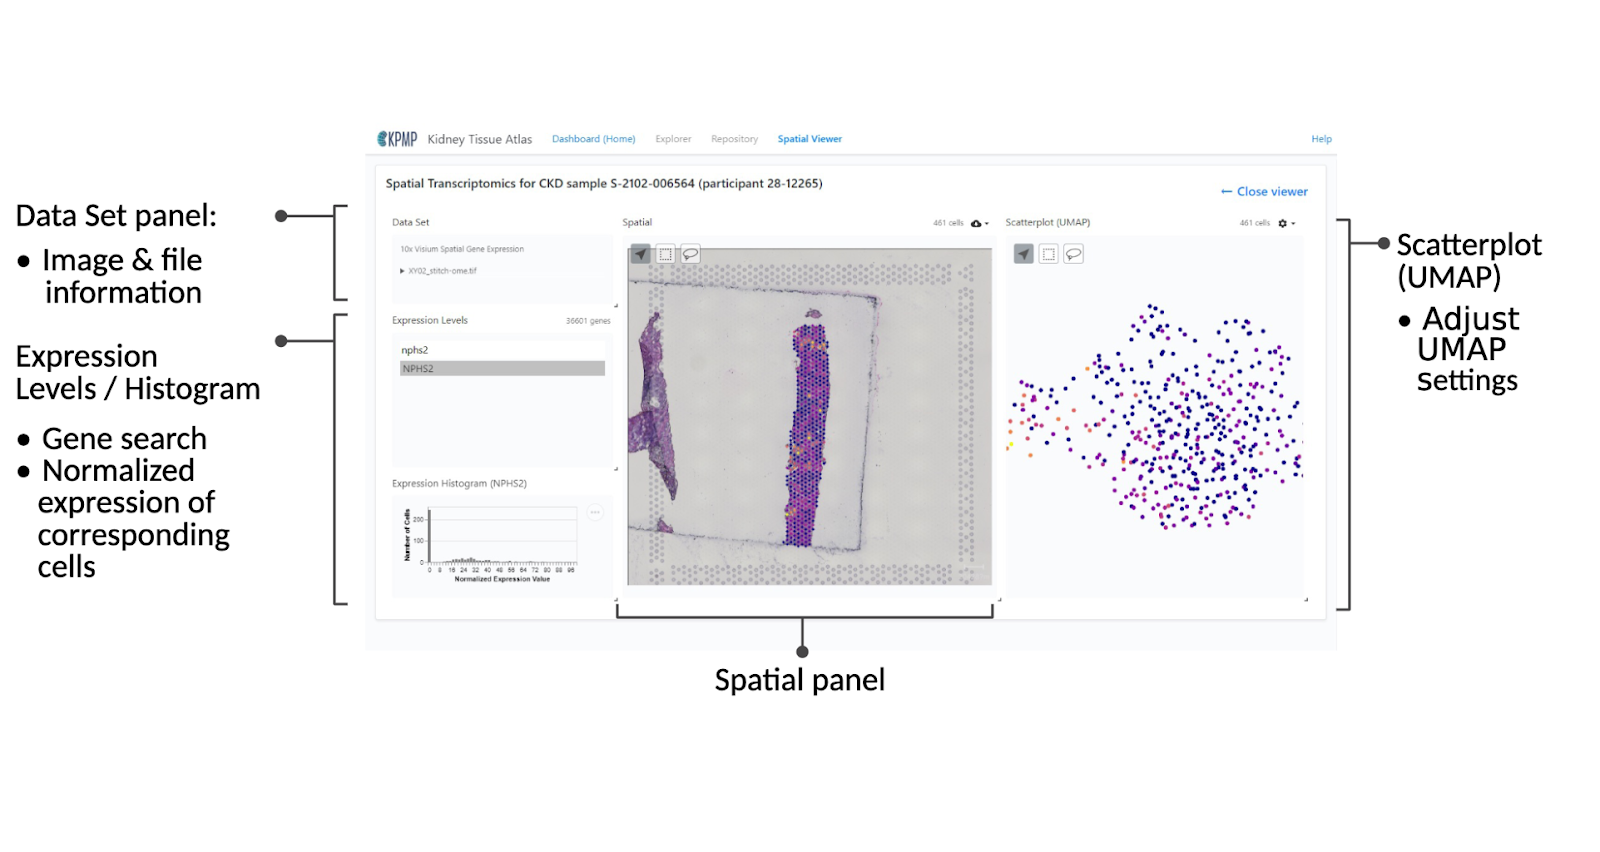
Expression Levels / Espression Histogram
Search for a gene of interest by typing the gene symbol of interest, select it, and the normalized expression level and corresponding number of cells will be graphed below in the Expression Histogram panel. Additionally, the Spatial and Scatterplot components will be updated to show the relative expression levels at different locations on the tissue.
Lassoing/Selecting data
In both the Spatial view and the Scatterplot view, there are a few tools that allow you to select certain points and have them highlight on the other view. This can be especially helpful when looking at the expression levels on the scatterplot. If you see a grouping of spots you can see where they live on the tissue itself by using the lasso or box tool to select the points of interest.
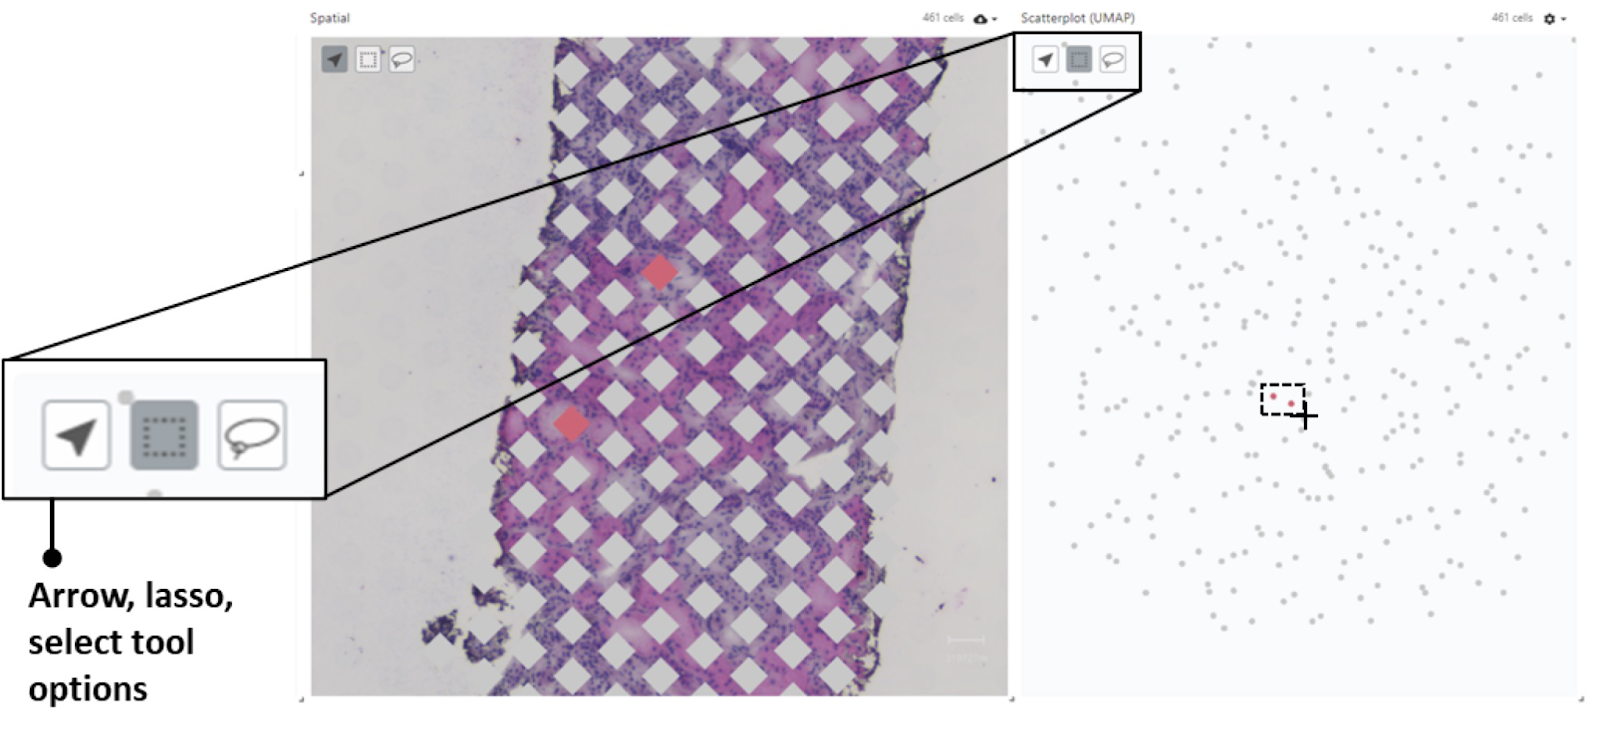
In order to clear your selection, simply reselect the gene of interest from the Expression Levels component on the left.
Search for a gene of interest by typing the gene symbol of interest, select it, and the normalized expression level and corresponding number of cells will be graphed below in the Expression Histogram panel. Additionally, the Spatial and Scatterplot components will be updated to show the relative expression levels at different locations on the tissue.
Spatial panel
The Spatial panel produces a heatmap showing the expression level for the selected gene on the various points on the tissue sample.
Scatterplot (UMAP) panel
Displays a scatterplot showing gene expression clusters and expression level for the selected gene as a heatmap.
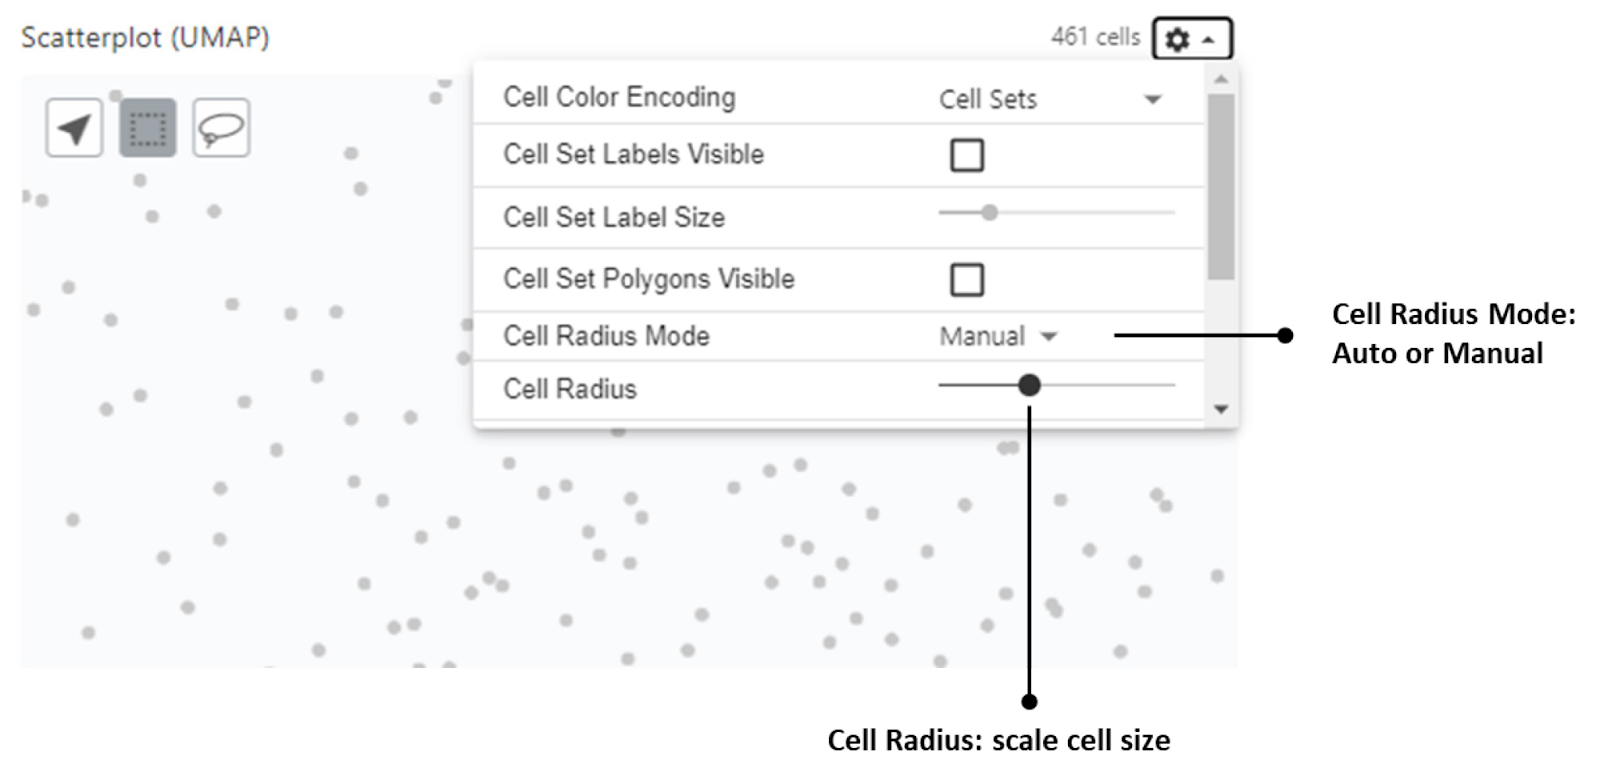
In the Scatterplot (UMAP) you can click the gear icon at the top in order to control a number of attributes on the scatterplot itself. The most useful control we have found is the ability to adjust the radius of the points in the scatterplot. In order to do this, you first change the Cell Radius Mode to Manual, and then you can adjust the slider to adjust the size of the points.
CODEX (CO-DETECTION BY INDEXING)
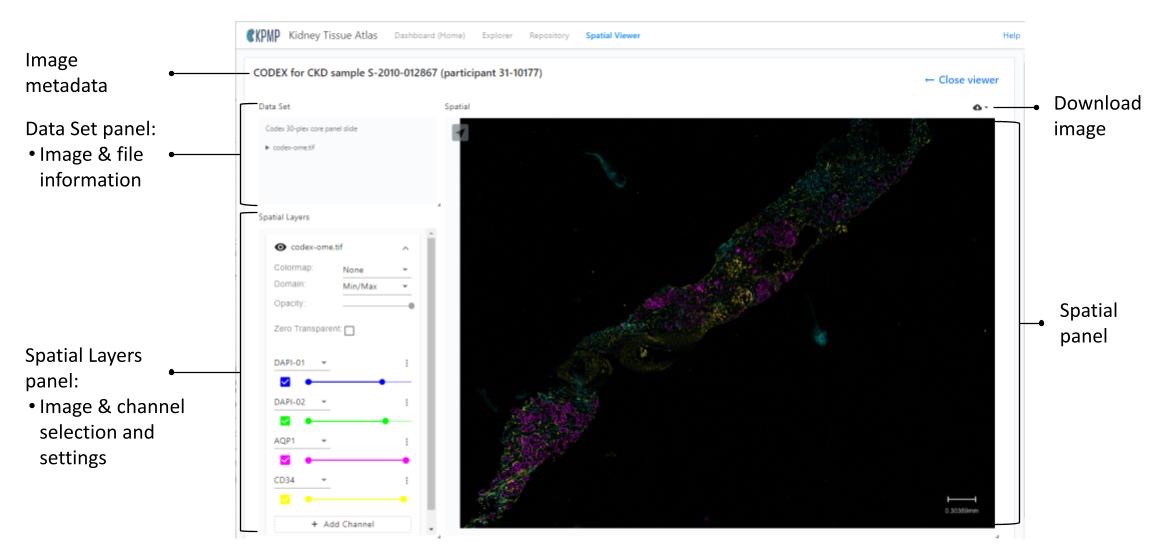
Image metadata
The image metadata on the left conveys the following information specific to the image:
- experimental strategy
- tissue type
- sample ID
- participant ID
Data Set panel
The Data Set panel displays the image information for the image shown in the Spatial panel:
- Image description/type (type)
- file name/type of the downloadable image
Spatial Layers panel
For images with multiple channels, a Spatial Layers panel appears under the Data Set panel. It allows you to add or remove channels, allowing a maximum of six total channels at one time.
Click on the arrow next to the channel / marker name to choose from over 50 markers for the channels. You may also choose from eight different colors for your channels.
Spatial panel
Zoom in and out of the image by using the scroll wheel on a mouse or with a trackpad.
To download the current image, click on the download icon in the upper-right corner of the Spatial panel.
SPATIAL METABOLOMICS, SPATIAL LIPIDOMICS, AND SPATIAL N-GLYCOMICS
METASPACE
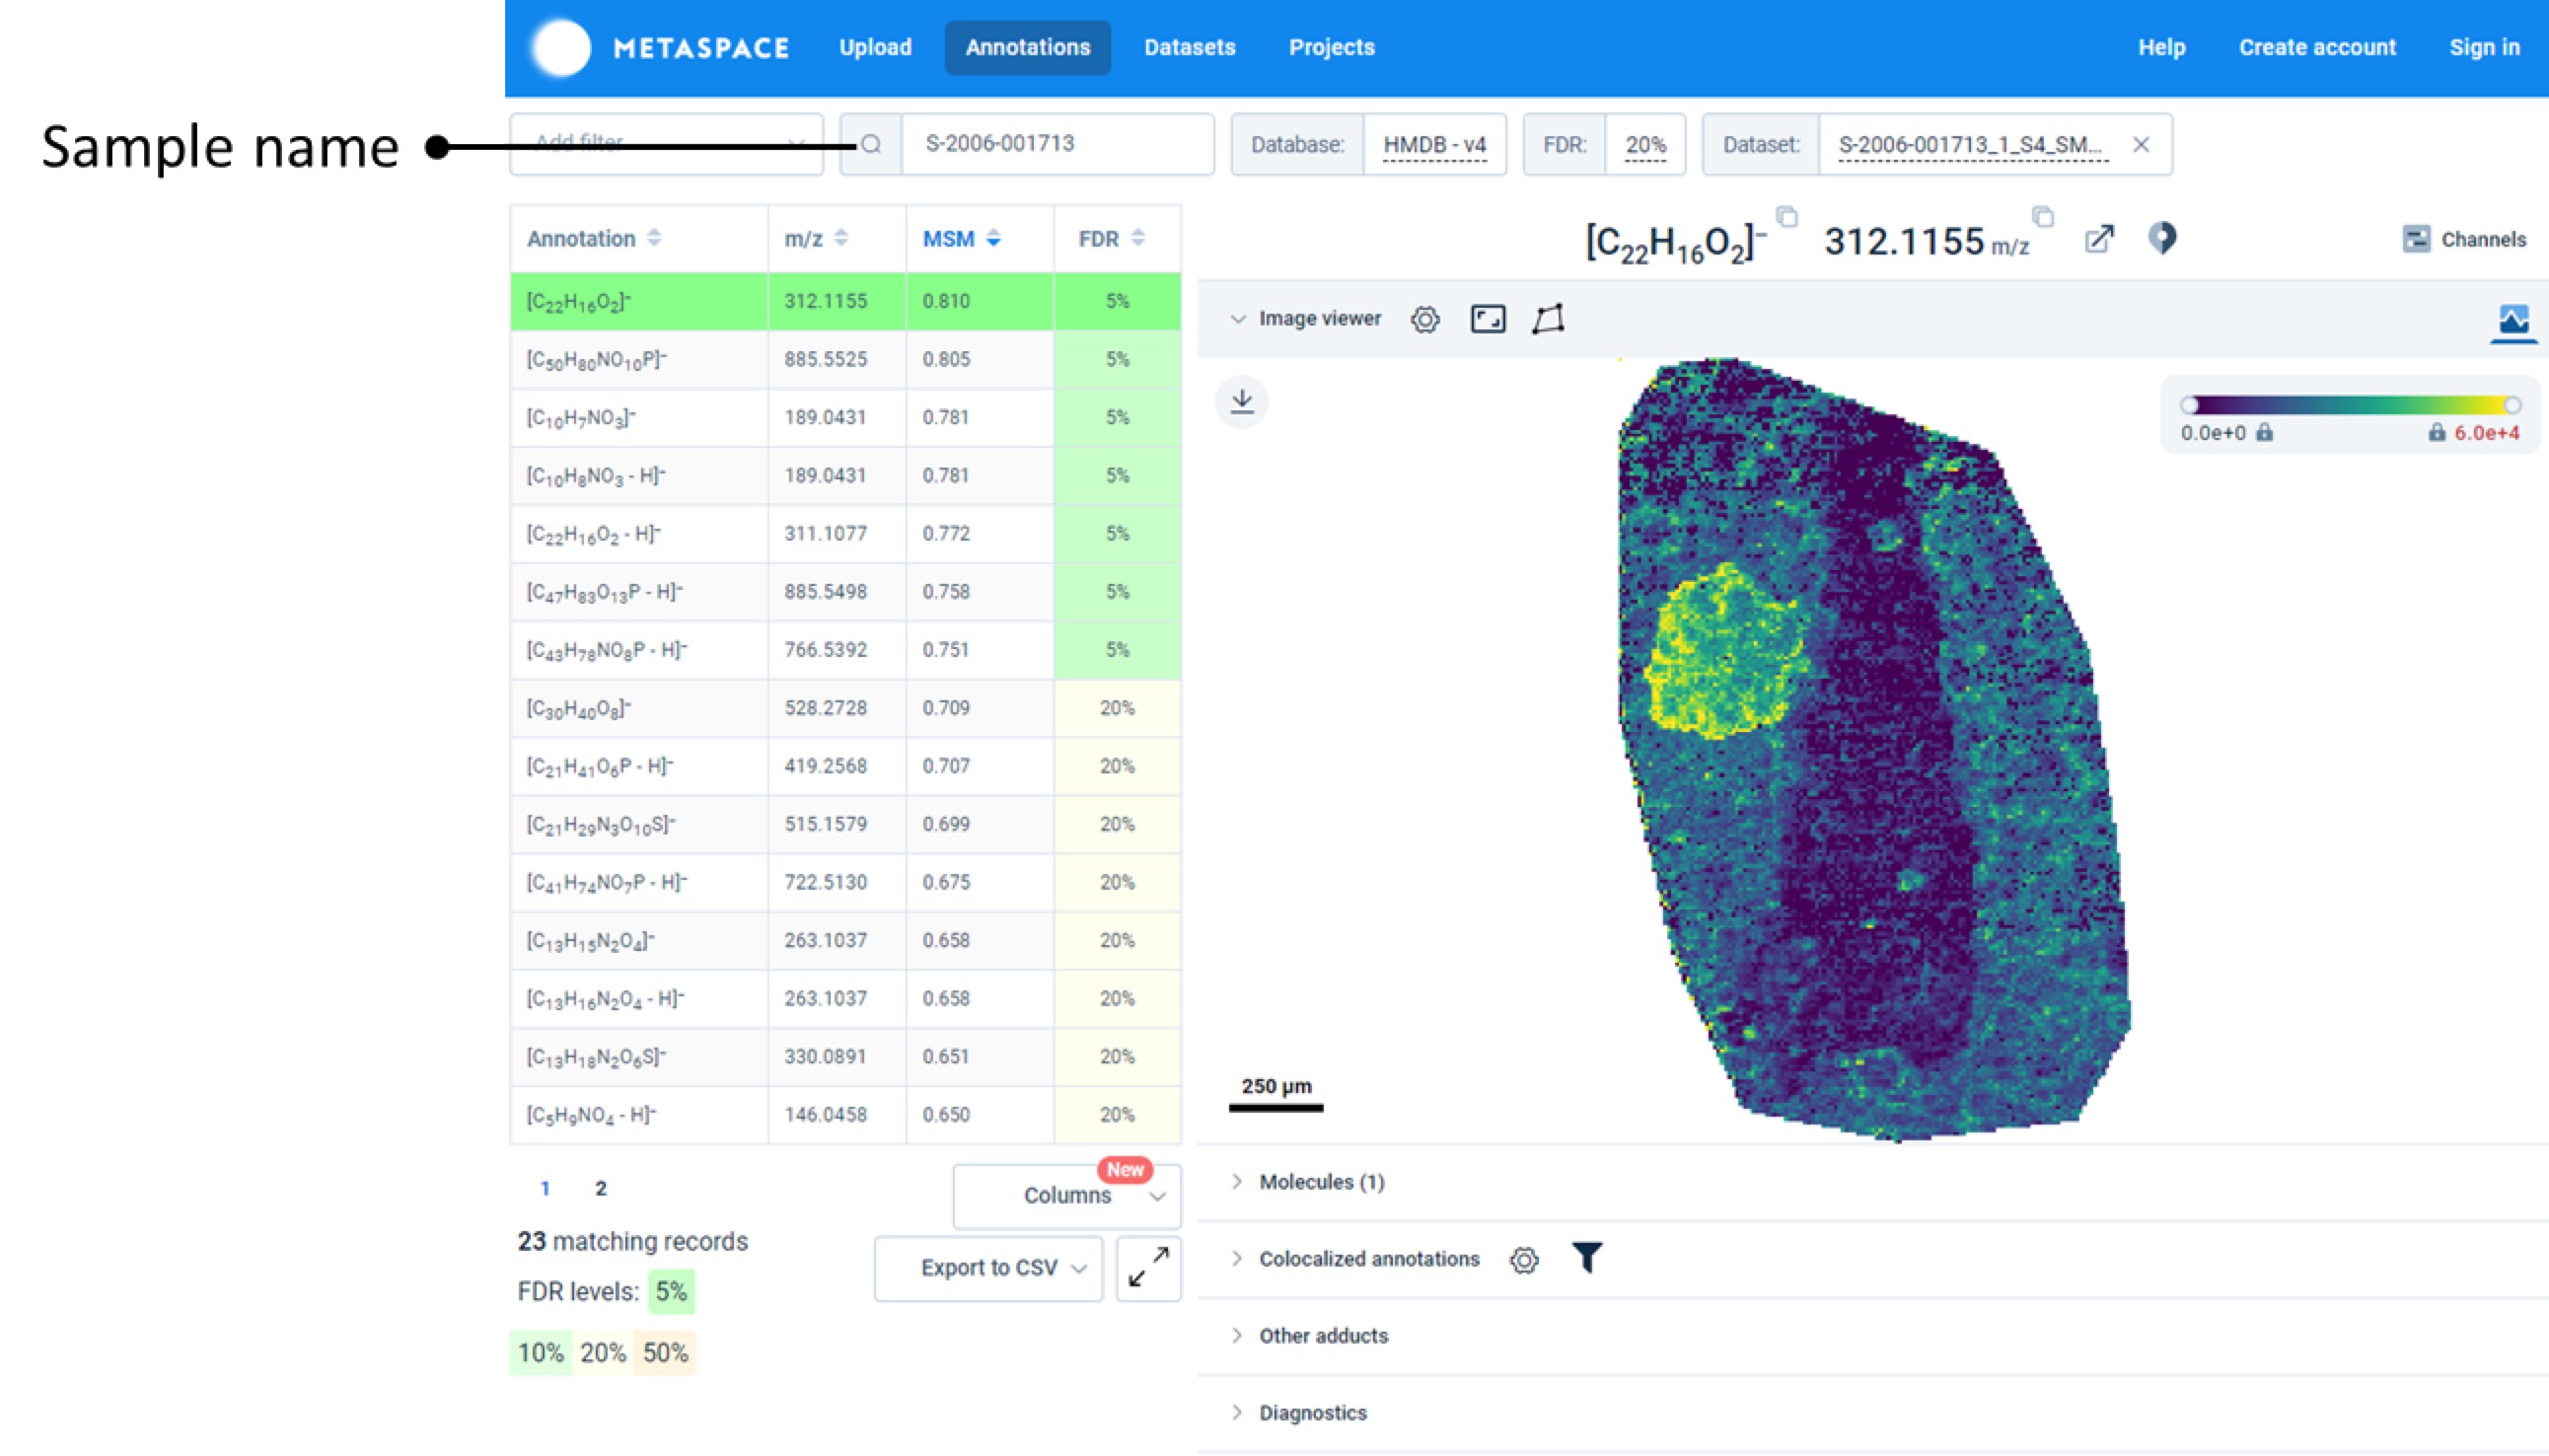
Spatial metabolomics, spatial lipidomics, and spatial N-glycomics data visualizations are available via hyperlinks within the Spatial Viewer to metaspace2020.eu.
Users may select data to view as normal and then follow the active hyperlinks for the appropriate visualizations.