Imaging
3D tissue imaging and cytometry, CODEX, imaging mass cytometry, and related imaging technologies.
JUMP TO:
- 3D tissue imaging and cytometry
- CODEX
- Imaging mass cytometry
- Multimodal imaging mass spectrometry
- Segmentation data modeling
3D tissue imaging and cytometry
Goal:
Understand the kidney in health and disease via 3D imaging and cytometric analyses.
.jpeg)
The following image types within this technology are available in the Kidney Tissue Atlas:
- Composite 3D 8-channel immunofluorescence image volume
3D volume completely represented as a stack of individual, 8-channel images. Every focal plane image and every channel can be independently inspected.
- Composite max projection of 8-channel immunofluorescence image volume
8-channel volume combined into a single maximum projection; composite image consists of 8 channels.
- RGB max projection of 2-channel (autofluorescence and second harmonic generation) image volume
Projection of 3D volume collected prior to labeling; channels cannot be controlled.
- RGB max projection of 8-channel immunofluorescence image volume
8-channel volume combined into a single maximum projection and converted to RGB color space.
Protocol(s)
METADATA STANDARDS
-
CODEX (CO-detection by InDEXing)
Goal:
To build a library of high-resolution phenotypical maps of kidney biopsies with anchor, immune, and functional markers for in situ spatial analysis at single cell resolution in normal and pathological conditions.
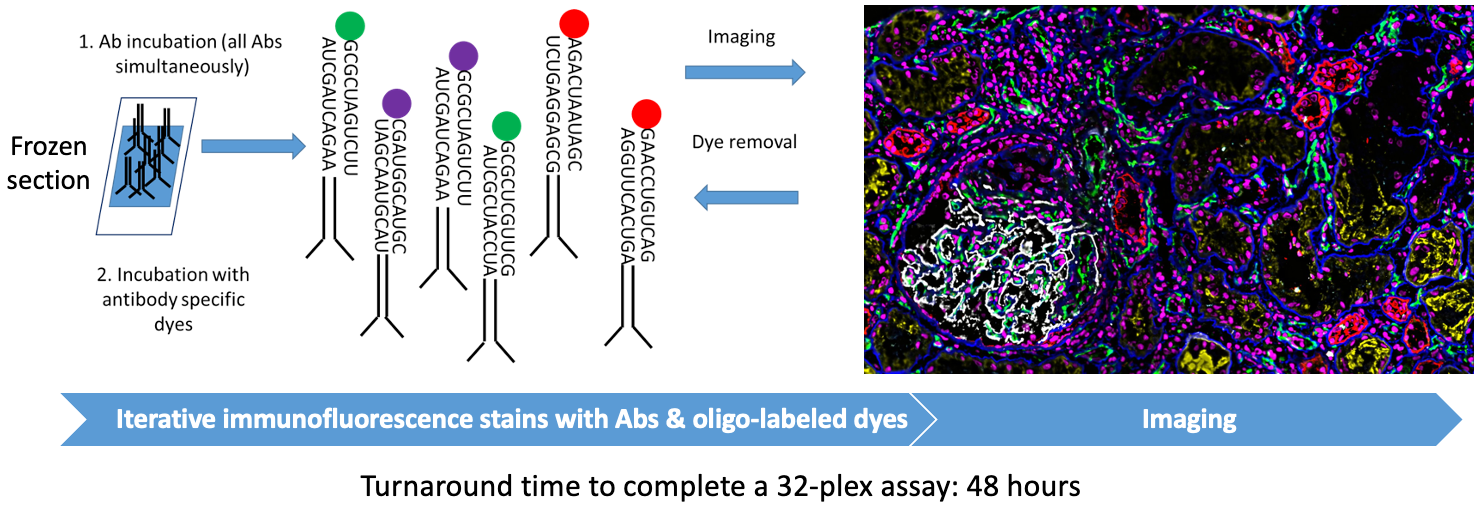
USING VOLUMETRIC TISSUE EXTRACTION AND ANALYSIS (VTEA)
PROTOCOL(S)
- (UCSF) Sample Preparation and Staining Experiment Protocol
- (UCSF) Imaging Setup and Processing Experiment Protocol
- (IU) Indiana University adapted Akoya Phenocycler-Fusion Tissue Staining and Imaging Protocol for Fresh Frozen Kidney Samples
METADATA STANDARDS
-
Imaging mass cytometry
Goal:
To generate high-dimensional spatially preserved data at single cell resolution to define the cellular milieu and cell-cell interactions in normal and injured kidneys.
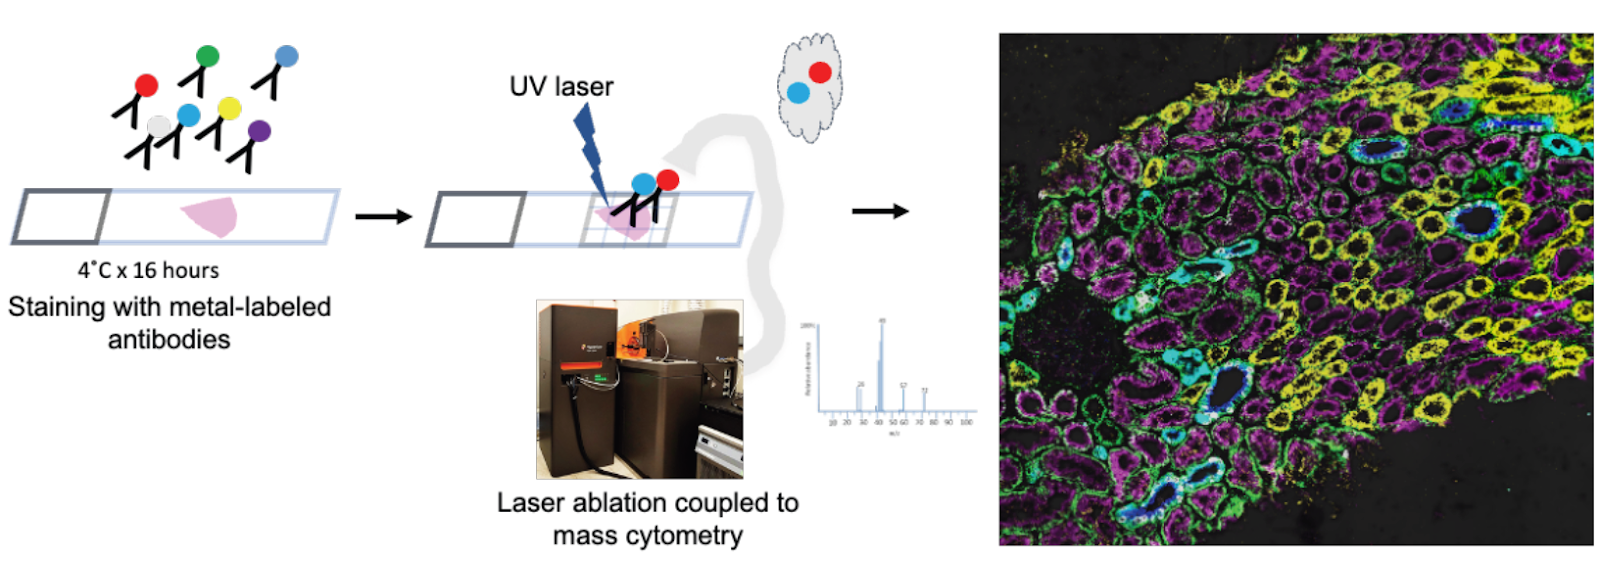
Protocol(s)
METADATA STANDARDS
-
MULTIMODAL IMAGING MASS SPECTROMETRY (MALDI)
Goal:
Our multimodal molecular imaging pipeline combines imaging mass spectrometry (IMS), Matrix-assisted laser desorption/ionization (MALDI) IMS, generates molecular images of metabolites and lipids with high spatial fidelity, showing localization to different functional tissue units (FTU) in the kidney. Analytes can be identified with a combination of accurate mass measurements (<1 ppm error) and complimentary liquid chromatography (LC)-based fragmentation experiments. By integrating this technology with advanced machine learning, Kidney Precision Medicine Project (KPMP) researchers will enable a more comprehensive understanding of the molecular and structural drivers of acute kidney injury (AKI) and chronic kidney disease (CKD).
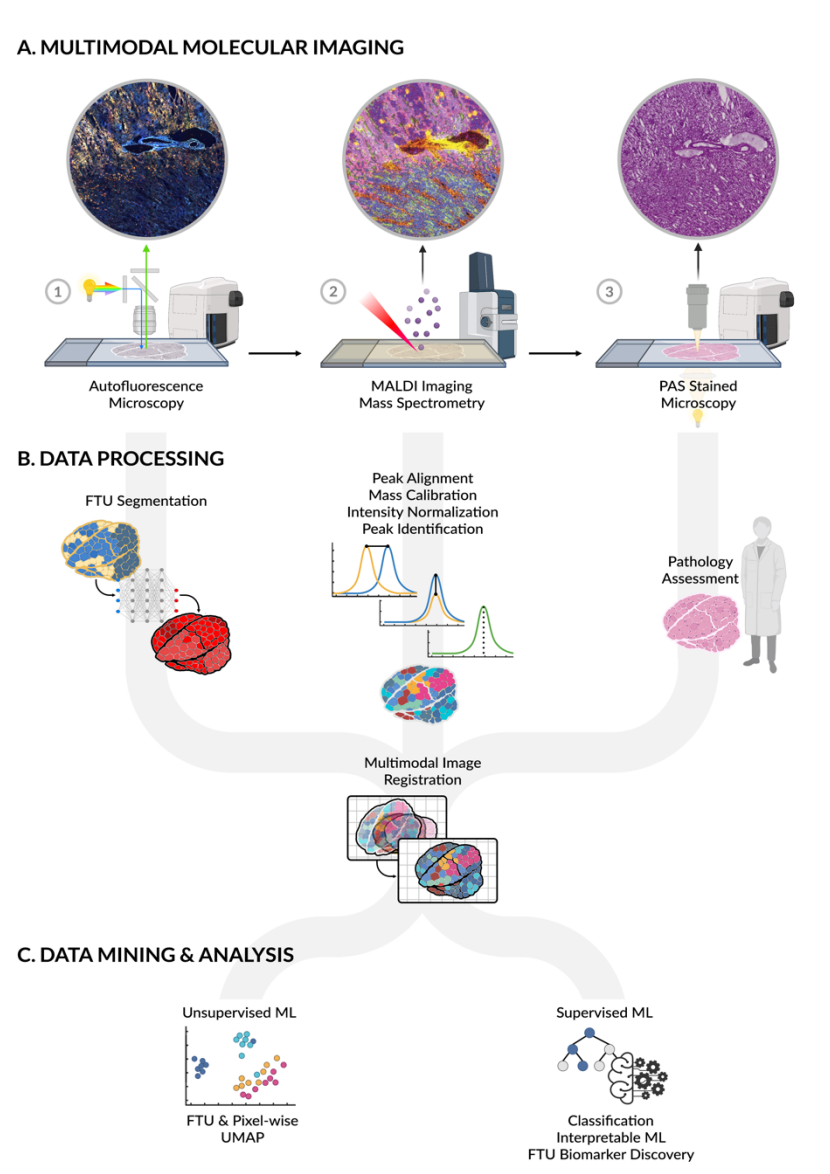
Protocol(s)
- Autofluorescence Microscopy QC for Multimodal Molecular Imaging
- Kidney Functional Tissue Unit (FTU) Segmentation
Protocols used by Vanderbilt University TIS for Multimodal Molecular Imaging of Human Kidney Biopsies
Overall Pipeline:
- VU TIS Multimodal Molecular Imaging Pipeline for KPMP Biopsy Interrogation (not yet available)
- Tissue Screening and Assessment (not yet available)
Sample Interrogation Assays:
- Autofluorescence Microscopy QC
- Autofluorescence Microscopy Data Collection
- MALDI IMS Matrix Deposition
- MALDI IMS Data Collection
- LC-MS/MS Lipidomics Data Collection
- Post-IMS AF Microscopy
- PAS Staining
Data Pre-processing and Analysis
- Multimodal Image Registration
- MALDI IMS Data Pre-processing
- Functional Tissue Unit Segmentation
- Analyte Annotation
- Quality Control (not yet available)
METADATA STANDARDS
-
SEGMENTATION DATA MODELING
GOAL:
Using a deep learning model, segmentation masks that overlay KPMP biopsy PAS diagnostic core slide images are created to highlight the segmentation of functional tissue units (FTUs) in the kidney. Our deep learning model generates measurement data to go alongside the visualization of the FTUs of each slide that is processed.
The segmentation mask dataset is generated by analyzing PAS whole slide images using the CMIL Slide Archive tool. This tool digitally analyzes each slide and generates a series of segmentation masks that may be overlaid onto the slide image, highlighting FTUs. The model designed for this work was trained and retrained on disease and reference samples that does not include KPMP data. More details regarding the samples and methods can be found in Correlating Deep Learning-Based Automated Reference Kidney Histomorphometry with Patient Demographics and Creatinine (Ginely et al., 2023). Each segmentation map produced on KPMP data using the initial model was reviewed by pathologists for accuracy. Future iterations of the model will include retraining with KPMP samples that have been confirmed by pathologist review to further strengthen the model.
Visualization of this dataset can be accessed in the Atlas Spatial Viewer by following these steps.
- Go to Atlas Spatial Viewer
- On the left sidebar, expand the Dataset Metadata section.
- Select the two options:
- Experimental Strategy: Light Microscopic Whole Slide Images.
- Image Type: PAS (Segmentation Masks). If you don’t see this, you may need to click +more

This will filter the dataset to match your selections. Click on the Sample ID link to open the dataset in the viewer (shown in the example below.) You can select different spatial layers of interest and adjust the color, transparency, and selection of the filled layer or line for a particular FTU as needed. Images can be zoomed in and out according to your specifications. You may also download the selected image.

Tissue areas and functional tissue units in the segmentation files include:
- IFTA (Interstitial Fibrosis and tubular atrophy)
- Peritubular capillaries
- Arteries/arterioles
- Tubules
- Globally sclerotic glomeruli
- Non-globally sclerotic glomeruli
- Cortex
Segmentation boundaries can be used for downstream analysis of renal function tissue unit morphometrics. Examples of included feature measurements are functional tissue bounding box coordinates, areas, and sub-segmentations such as mesangial area in glomeruli, and tubular basement membrane thickness.
Additional documentation on segmentation boundary definitions can be found on Protocols.io: Renal Multicompartment Segmentation Object Boundaries.
Codes and tutorials for the cloud-based segmentation model can be found on the SarderLab GitHub.
In addition, you can also find the codes for the feature extraction pipeline on SarderLab Github as well.