Atlas Explorer
Search the Atlas Explorer by gene or cell type and view summary visualizations across data types.
The Atlas Explorer incorporates an easy-to-use search engine which allows users to search for markers or cell types of interest and view summary data visualizations across the following data types:
- Single-nucleus RNA-seq
- Single-cell RNA-seq
- Regional transcriptomics
Summary of participants by data type
A summary of the data available in the Atlas Explorer is available on the Kidney Tissue Atlas homepage.
The single-nucleus and single-cell datasets are described in detail in this preprint (Note: the v1.0 Atlas Explorer includes only a subset of the samples described); the manuscript also details the approach to assigning cell types to the clustered data.
The cell types noted in the application were established as a joint effort with the HuBMAP Consortium. The HuBMAP ASCT+B Reporter tool can be used to visualize the anatomical structures, cell types, and biomarkers (ASCT+B) authored by the domain experts. The cell types and anatomical structures are also being represented in the Cell Ontology and Uberon, respectively.
Search by gene
Searching for a gene presents the user with various visualizations and data tables displaying how the gene is expressed in the selected data type.
Choosing the single-nucleus or single-cell RNA-seq data types yields a visualization page with a "reference UMAP" showing how the full dataset was clustered as well as the inferred cell type/state of each cluster (see this preprint for more details on the clustering and cell attribution methods); a feature plot showing the expression of the selected gene, and a table detailing the expression of the selected gene in each cluster (compared to all other clusters) (Figure 1). Users can also filter the dataset down to only include AKI, CKD, or healthy reference samples - this updates the gene feature plot and the table (but not the reference UMAP image).
.png)
Searching for a gene and choosing the regional transcriptomics data type yields a visualization page with a "bubble plot" showing the expression of the selected gene across all tissue types (AKI, CKD, and healthy reference tissue) and microdissected regions, and a table detailing the expression of the selected gene in each region compared to all other regions (Figure 2). Users can also filter the dataset down to only include AKI, CKD, or healthy reference samples.

Search by cell type
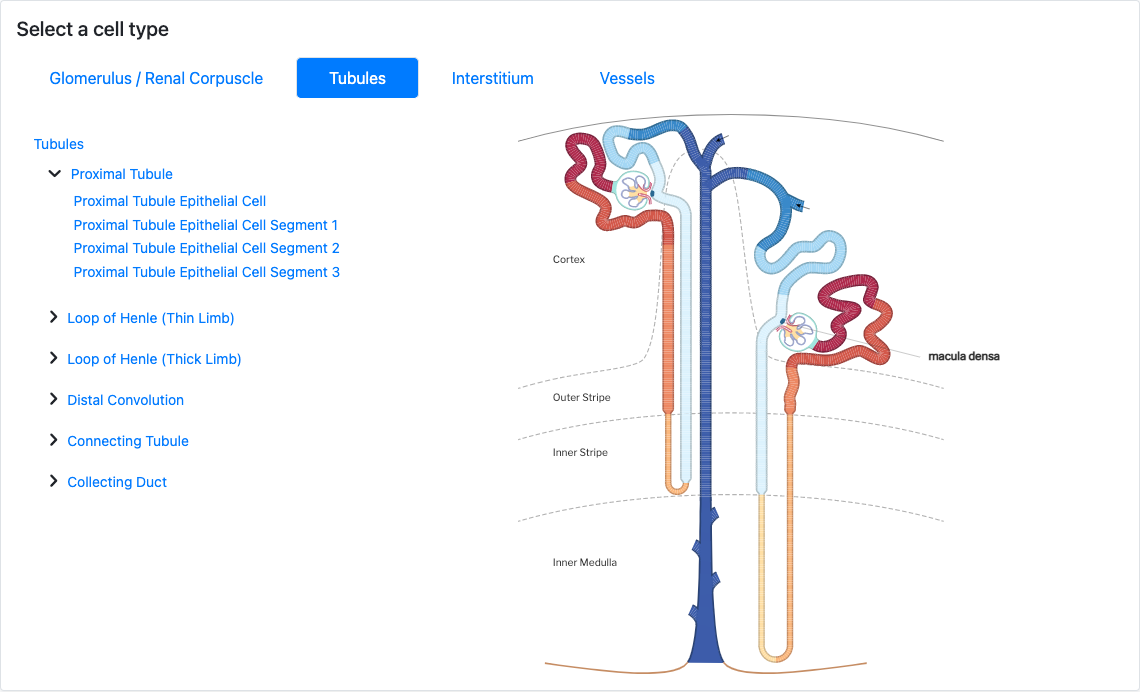
Users can also begin their search with a cell type instead of a gene. After searching for a cell type or selecting one from the renal corpuscle or nephron schemata (Figure 3), a user can see all of the data currently mapped to that cell type. As of Atlas Explorer v1.0, the available data will be single-nucleus and single-cell clusters or microdissected regions. After choosing one of the clusters/regions, users are presented with a table showing which genes are most differentially expressed in the selected cluster/region.